Finding the right abstractions for developer workflows to support search, context, and learning.
The Problem: Learning from Developer Workflows
AI-augmented programming has become ubiquitous, but current evaluation systems measure outputs, not workflows. An AI that produces correct code through 50 trial-and-error attempts scores identically to one that succeeds immediately—yet iteration cost matters because developers must understand, review, and extend AI-generated code.
Software systems have grown into digital ecosystems too large for any one person to understand. At this scale, developers no longer write functions—they orchestrate changes across modules, navigate dependency graphs, and coordinate with tools that generate code autonomously. The challenge is no longer code generation alone, but how AI systems search, reason over, and learn from prior work across time, projects, and workspaces.
The core question: Can we capture the how and why of development activity (the procedural knowledge) in compressed, privacy-preserving abstractions that enable faster onboarding, better search, and cumulative collaboration?
Key Findings
- Motifs achieve 98.4% classification accuracy with 242× compression, matching raw trace performance with near-zero privacy risk.
- Development workflows exhibit Small-World network properties (σ > 1), with changes propagating through modular community structures.
- 60% of activity is concentrated in the top 10% of "hot" files, suggesting high optimization potential for context retrieval.
Overview
Software development is fundamentally cumulative. Progress depends on the ability to return to prior work, understand what was done and why, and extend it meaningfully over time—whether by an individual revisiting their own code or by collaborators inheriting a system long after its original context has faded.
Why learn from traces? Repository-level representations capture what code exists but not how it came to be. Function-level snapshots miss the iterative cycles of prompt, edit, and verification that characterize AI-assisted work. When a developer reverts an AI-generated change, that signal is lost in final artifacts but preserved in traces. When a refactoring cascades through 20 files versus 3, traces capture the difference. Traces reveal engineering intuition and procedural constraints that static code does not encode.
This project produces three main artifacts: a companion service that captures developer activity in real time via Model Context Protocol (MCP), a dashboard for visualizing and analyzing developer workflows, and research evaluating privacy-preserving abstraction rungs for cumulative software engineering.
Our analysis of 40,000+ developer sessions reveals that workflows exhibit measurable network properties—reproduction numbers, cascade structures, small-world clustering—providing vocabulary for understanding development processes. We demonstrate that abstraction trades expressiveness for privacy in predictable ways: motifs achieve 98.4% classification accuracy with 242× compression, and structural patterns generalize across languages where token sequences do not.
Core Contributions
Companion System
Captures developer activity in real time via Model Context Protocol (MCP), providing a foundation for studying AI-assisted workflows.
Abstraction Ladder
Six representation rungs that progressively compress traces while preserving procedural knowledge for privacy-preserving analysis.
Classification Accuracy
Motifs achieve 98.4% accuracy with 242x compression and near-zero privacy risk.
Research Vision
As AI systems increasingly participate in software development as autonomous and semi-autonomous actors, preserving cumulative progress becomes a design problem rather than an implicit byproduct of human practice. The central challenge is no longer code generation alone, but how AI systems search, reason over, and learn from prior work across time, projects, and workspaces.
Our vision is to enable human-centered, AI-assisted software engineering in which developers and code agents can reliably return to past context, retrieve relevant experiences, and build on prior decisions. This requires treating developer workflows as a first-class source of intelligence, not just code snapshots or diffs. We argue for new intermediate representations that function as scaffolding for long-term reasoning and retrieval. These representations make it possible to build automated developer memories that are both useful and privacy-preserving, enabling search across multiple workspaces, sessions, and projects without collapsing everything into a single monolithic context or exposing sensitive code.
Current AI-assisted development tools operate on incomplete signals. Platforms like GitHub preserve outcomes, but much of the process that enables understanding and reuse is lost. IDE telemetry is rich but opaque, difficult to share, and unsafe to reuse directly. As a result, today's code agents lack durable memory and rely on short-term context windows rather than accumulated experience.
Instead of replaying raw logs, agents can search over abstracted workflow traces that encode navigation patterns, debugging strategies, refactoring sequences, and responses to feedback. This enables agents to go back in time in a meaningful way, retrieving prior solutions, failed attempts, and design rationale when they are relevant.
This approach also enables more efficient and configurable code agents. By operating over compressed, task-appropriate representations, agents can be trained and deployed with lower storage and compute costs and routed dynamically based on task requirements. This opens the door to interoperable agent ecosystems, including model routing and configuration frameworks such as OpenRouter, where agents specialize based on how they reason rather than how much raw context they consume.
Developer workflows become shared scaffolding for collaborative reasoning, allowing both humans and AI systems to learn from past work without direct access to source code.
Companion Service & Dashboard
A production-ready, local-first backend that captures developer activity in real time from Cursor IDE via Model Context Protocol (MCP). The service transforms raw traces into privacy-preserving abstraction rungs (differential privacy and k-anonymity) and provides a dashboard with key functionalities:
- Search back in time: Retrieve past workflows, decisions, and context across sessions and projects.
- Multi-workspace search: Privacy-preserving search across multiple workspaces without exposing sensitive code.
- Export and share: Export workflow traces at different abstraction levels for sharing and analysis.
- Live telemetry inspection: Exploratory analytics for understanding developer behavior.
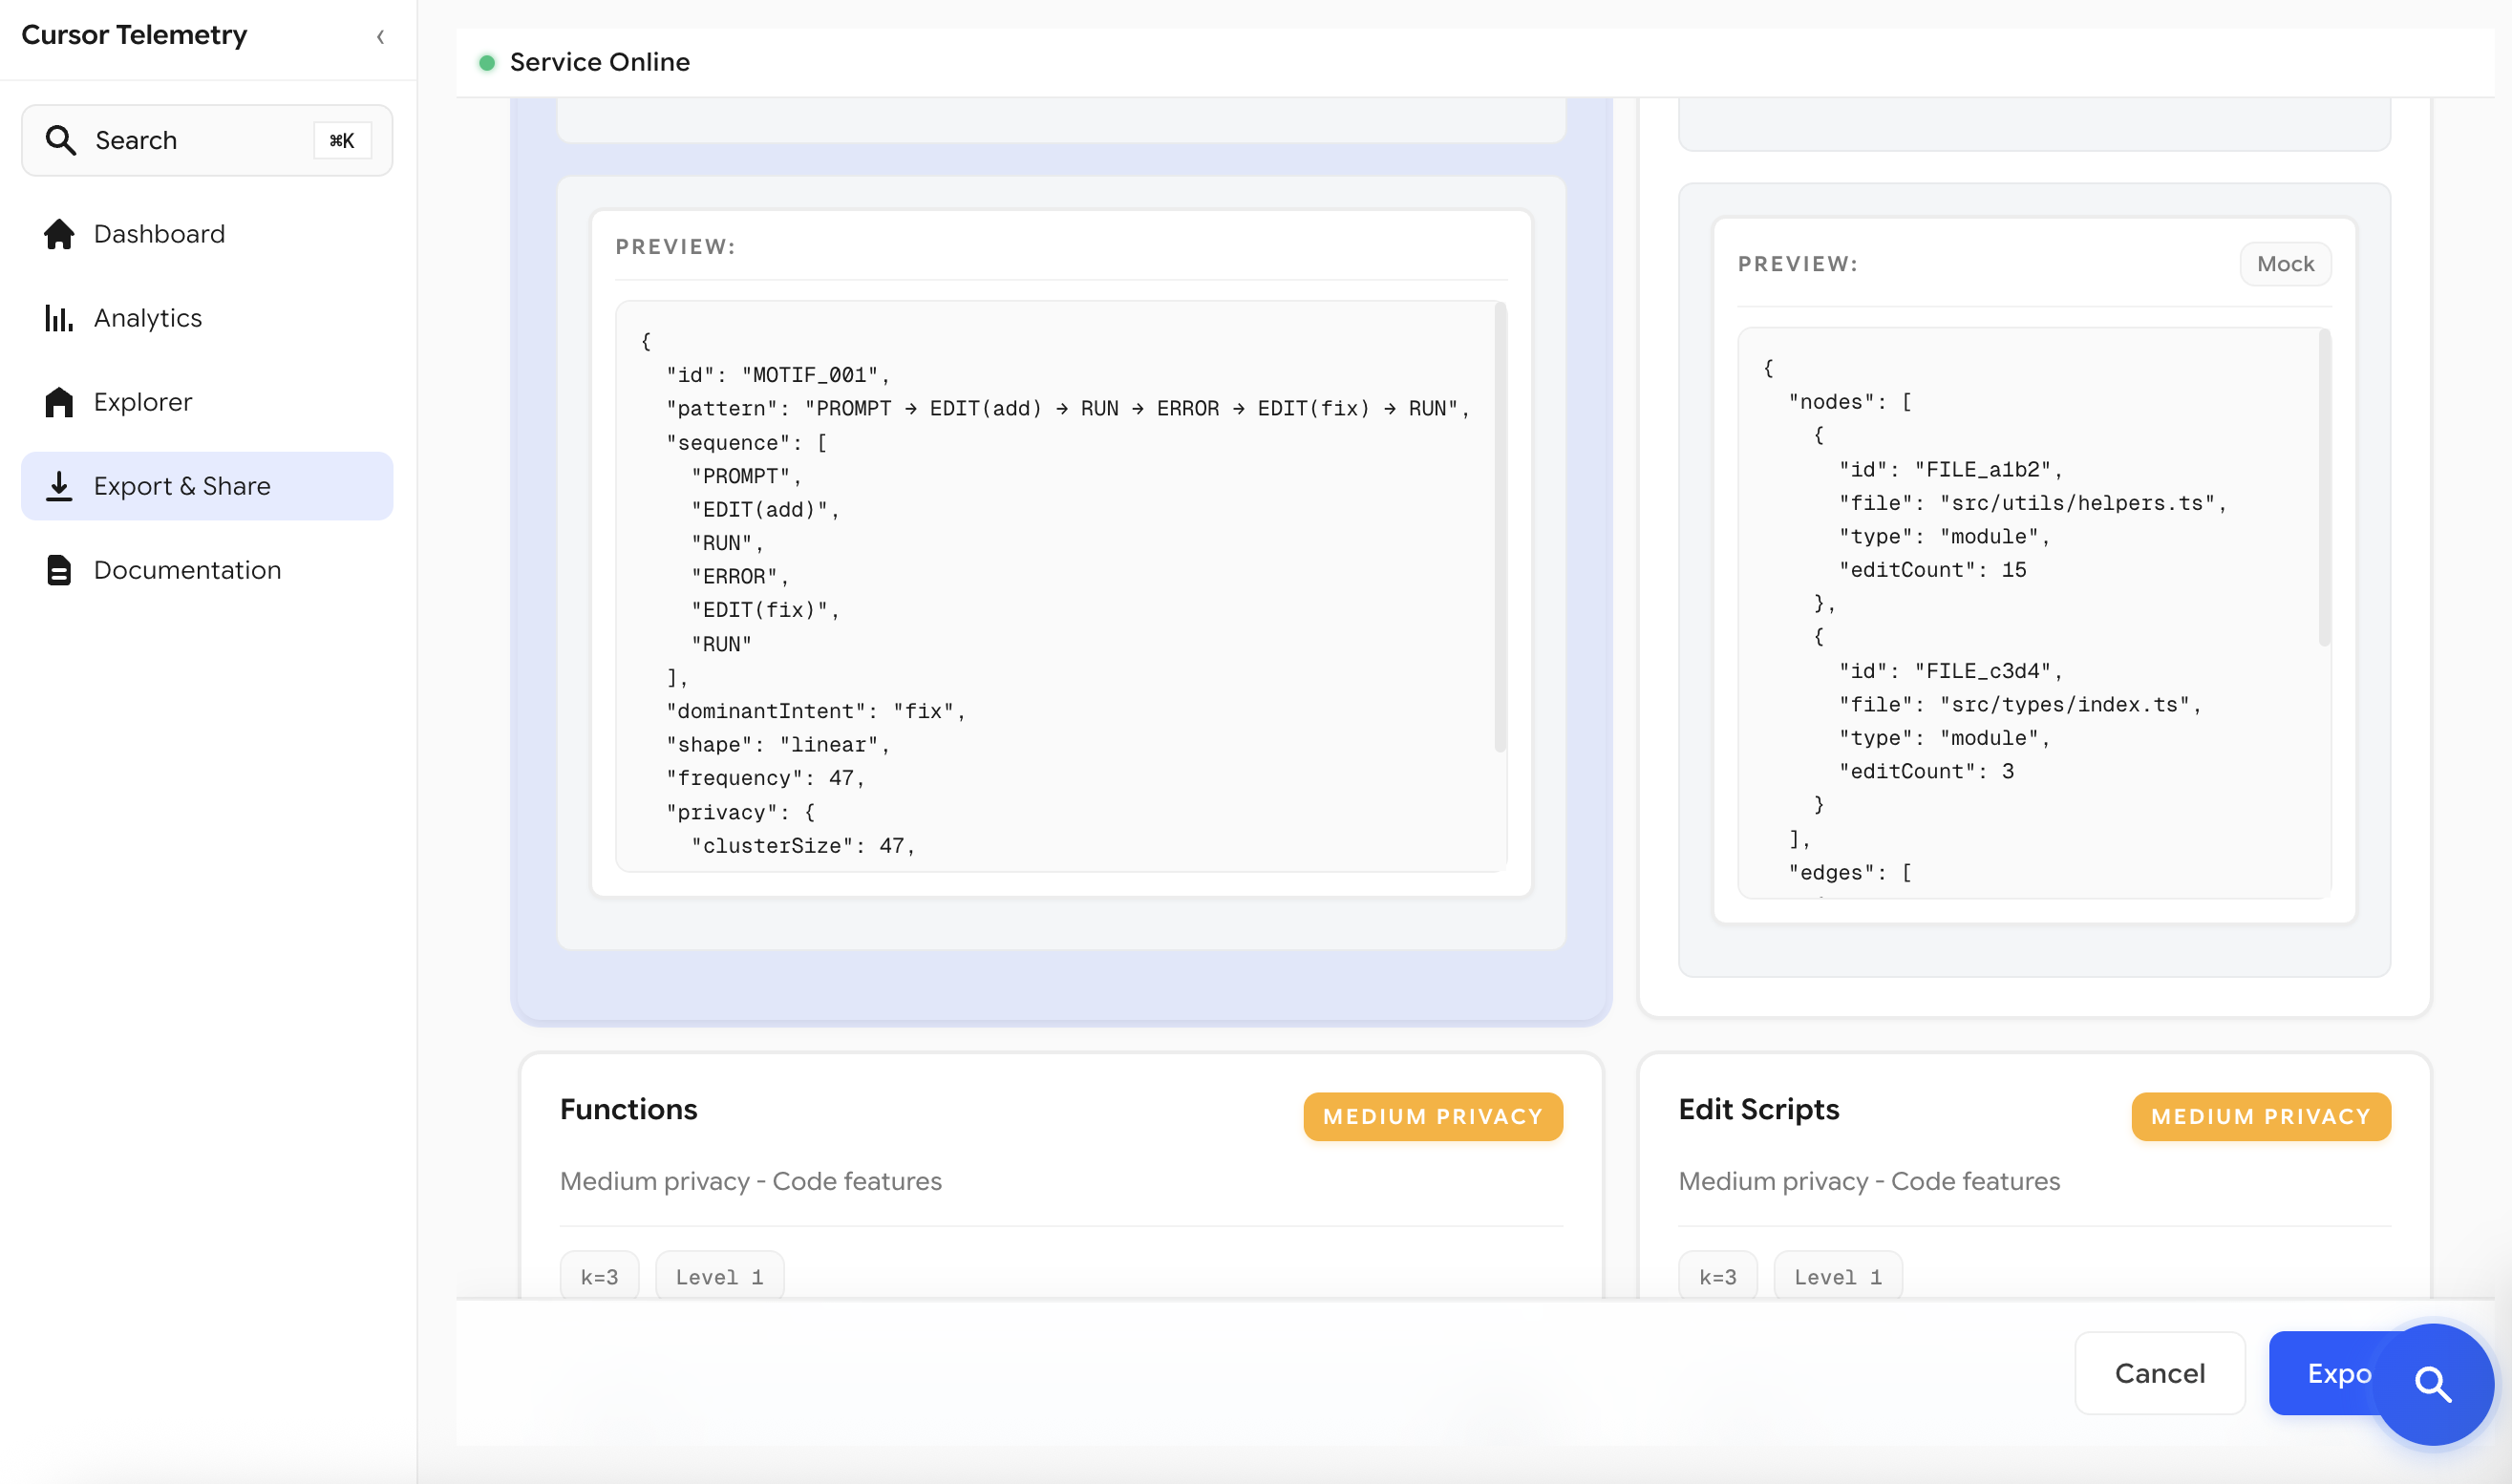
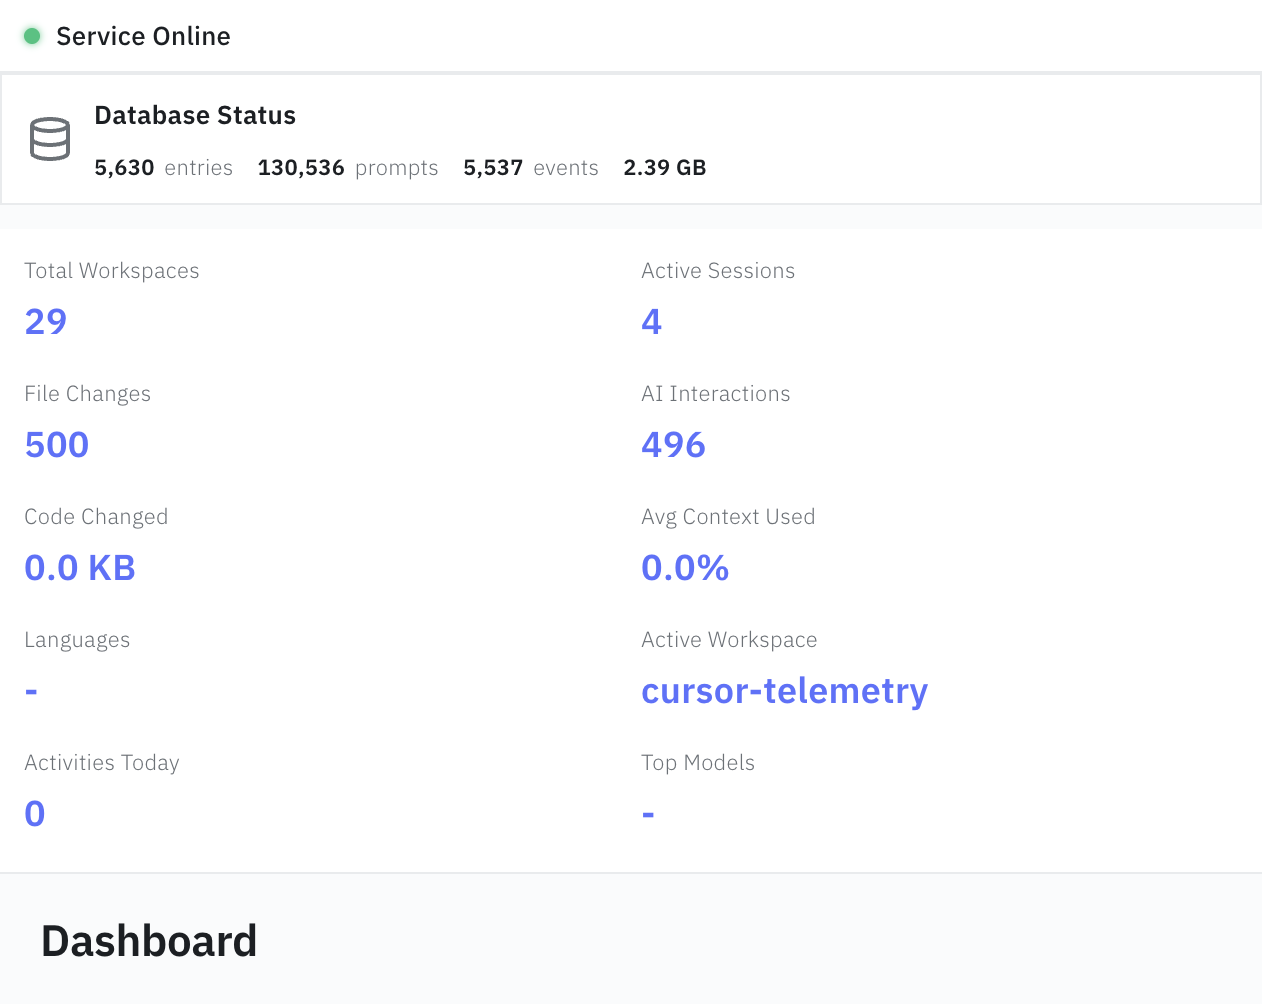
Dashboard Interface
The dashboard provides real-time visualization and analysis of captured telemetry data, enabling developers to explore their workflows, understand patterns, and export traces at different privacy levels.
📦 Install Companion Service
Get started with the companion service in seconds. Capture developer workflows, analyze patterns, and export data at different privacy levels.
# Clone and install
git clone https://github.com/hamidahoderinwale/bidirect-align-dev-traces.git
cd bidirect-align-dev-traces/companion
npm install && npm start
Quick Start: Clone the repository, install dependencies, then run npm start.
The service runs on http://localhost:43917 and begins tracking your Cursor IDE workflows automatically.
See the README for full documentation.
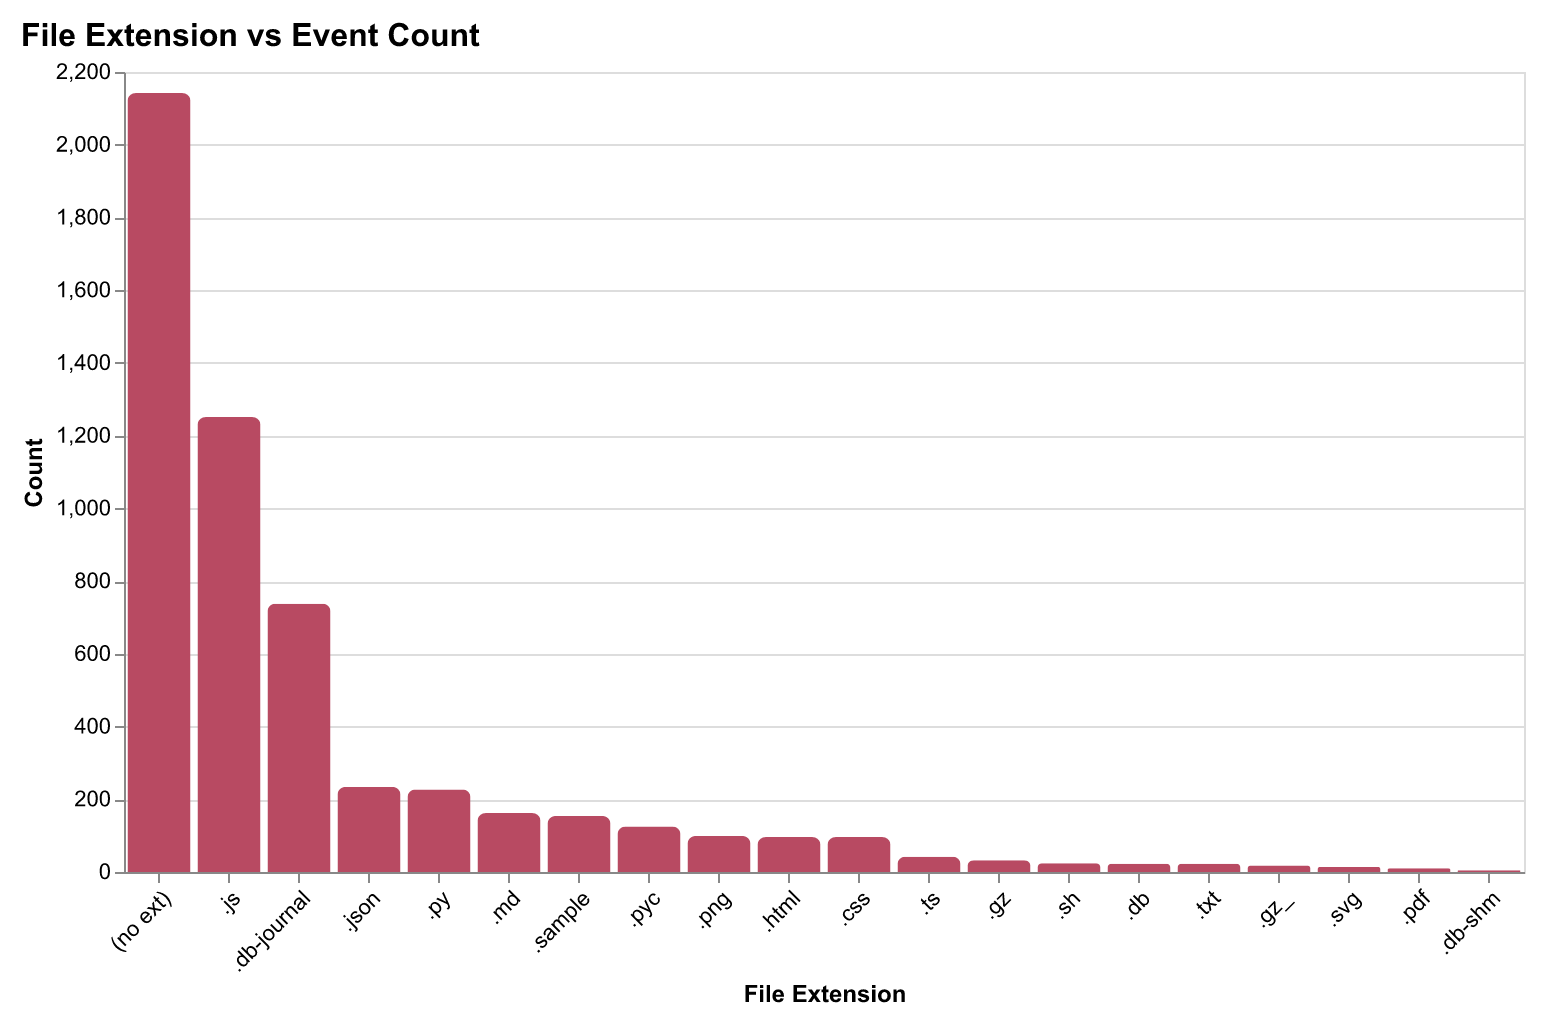
What Data is Captured
The companion service operates as a local SQLite-backed logger capturing events in real-time, grouped by session. Over 78 days of operation, the system captured 40,000+ sessions, 124,000+ prompts, and 614,000+ terminal commands with negligible overhead.
The system records five event types:
| Event Type | Fields Captured |
|---|---|
| Code changes | File path, diff, lines added/removed, timestamp, session |
| Prompts | Prompt text, response, model, context files, timestamp |
| Context snapshots | Files in context, token counts, truncation status |
| Terminal commands | Command, working directory, exit code, duration |
| Conversations | Conversation ID, prompt sequence, session linkage |
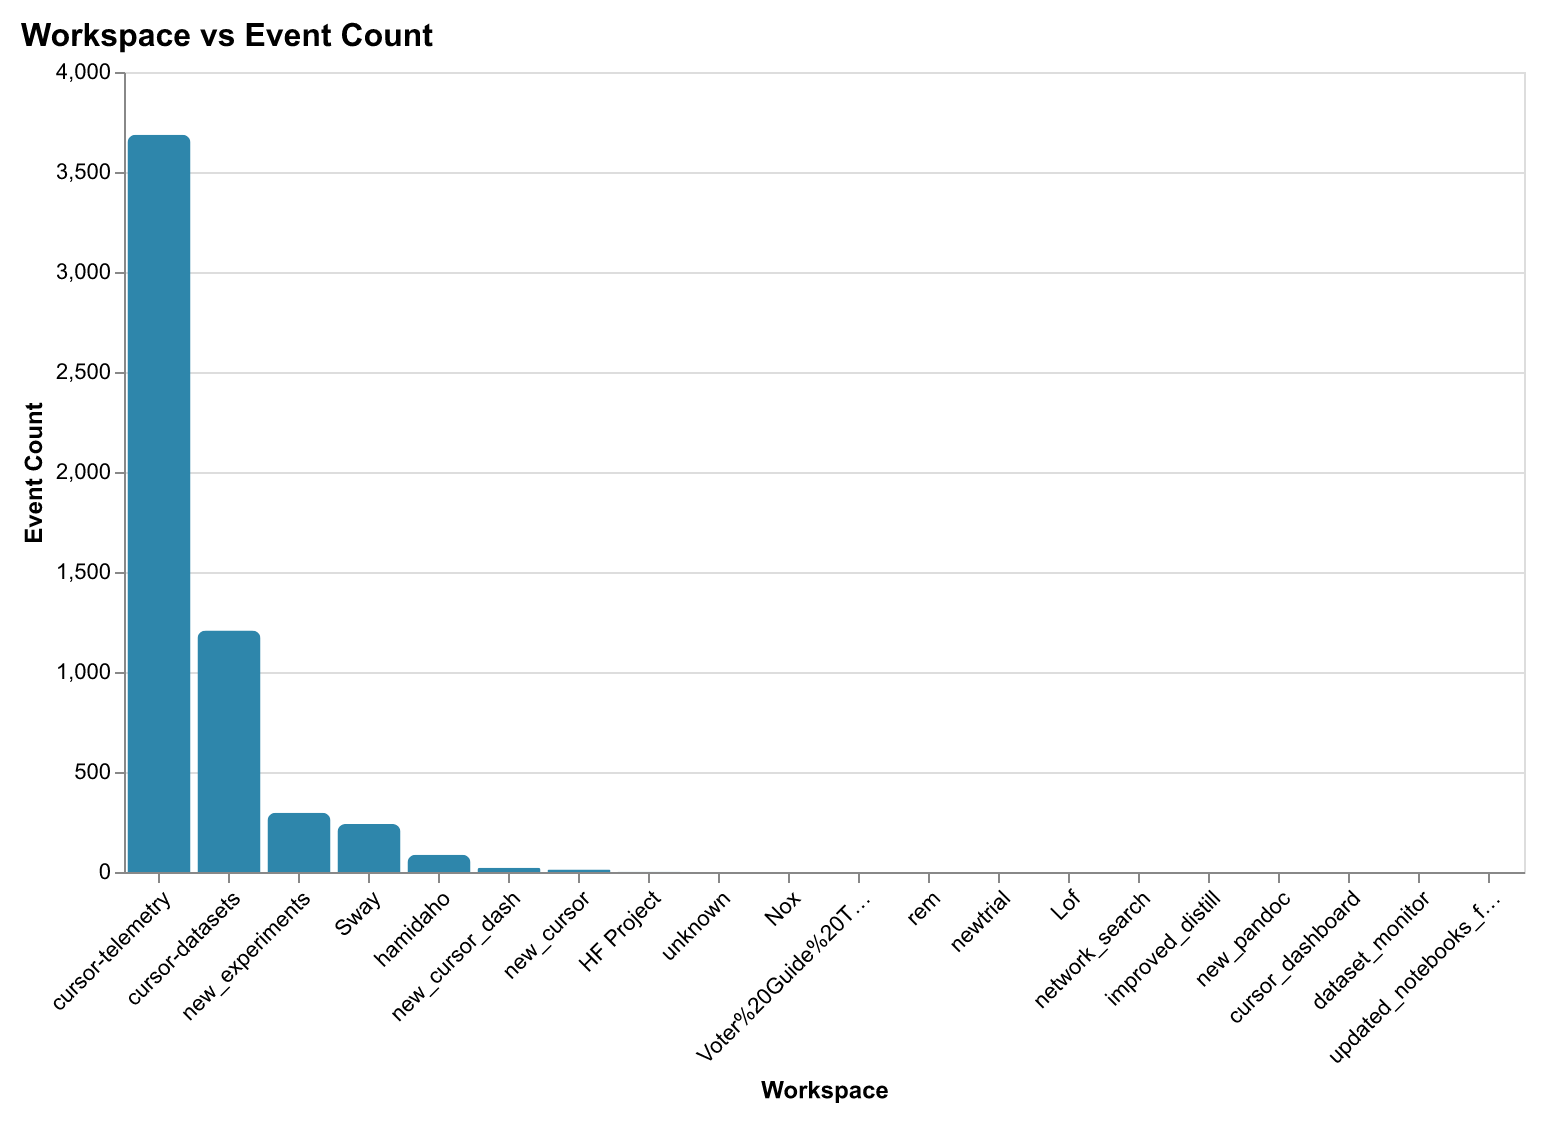
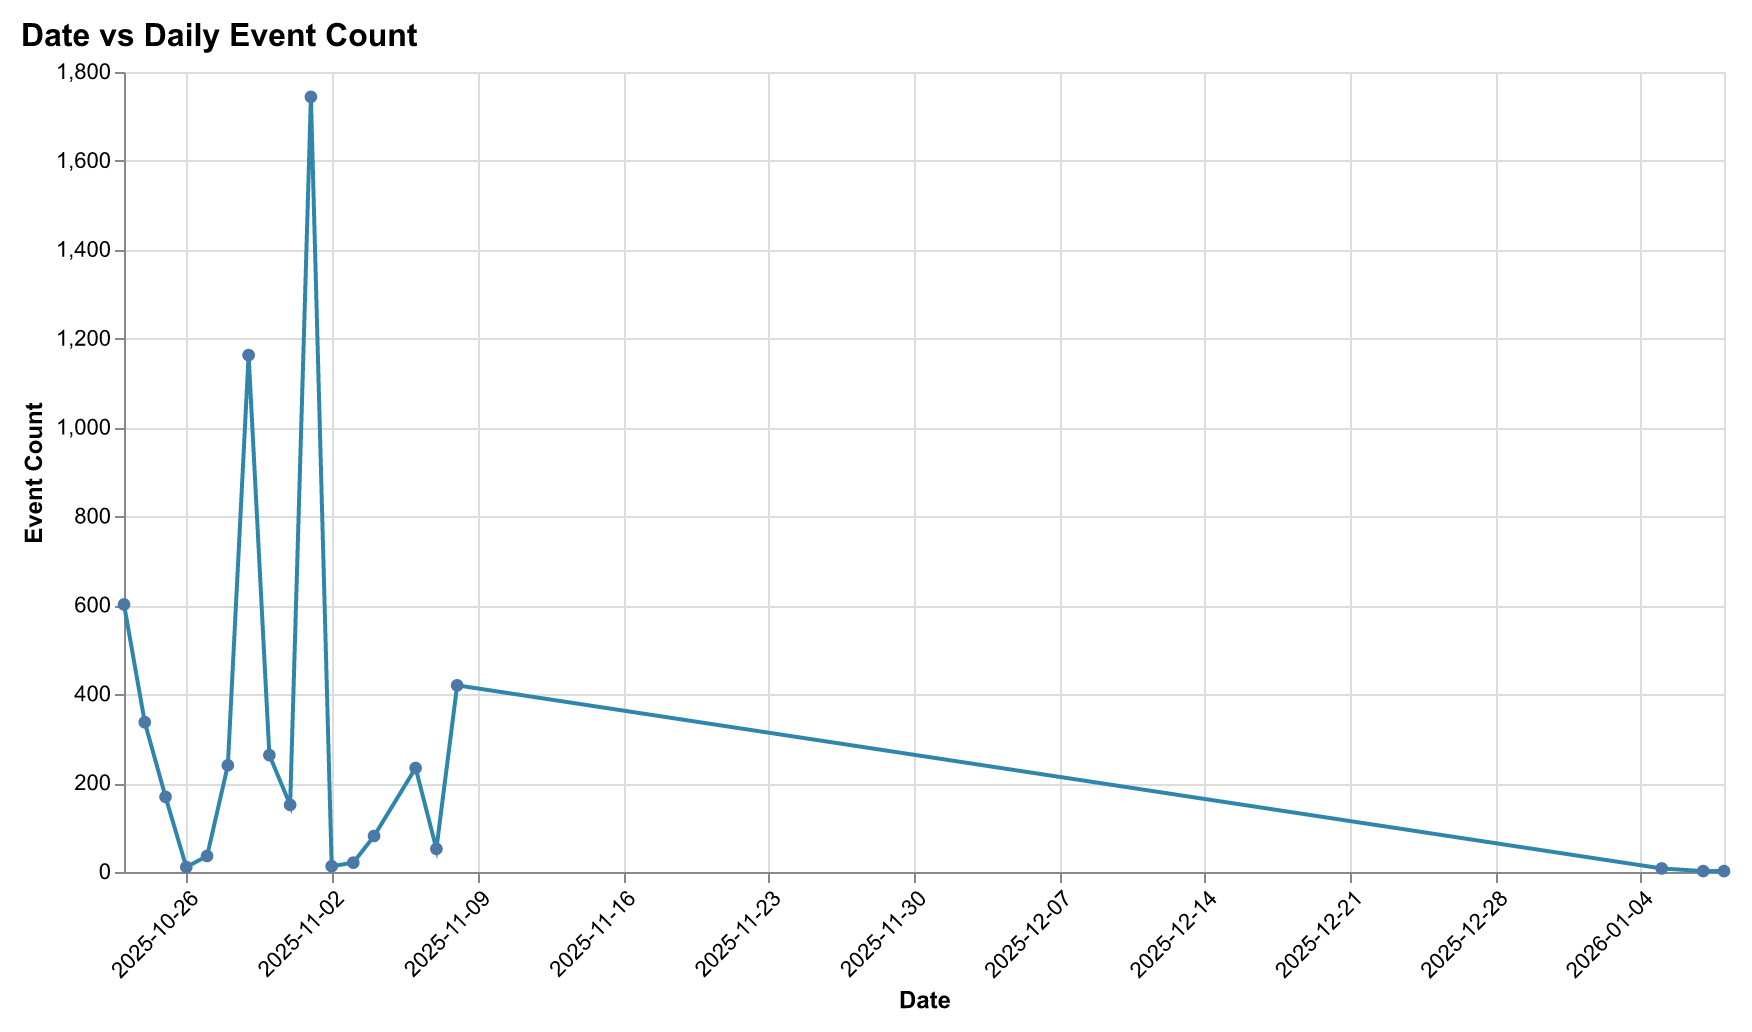
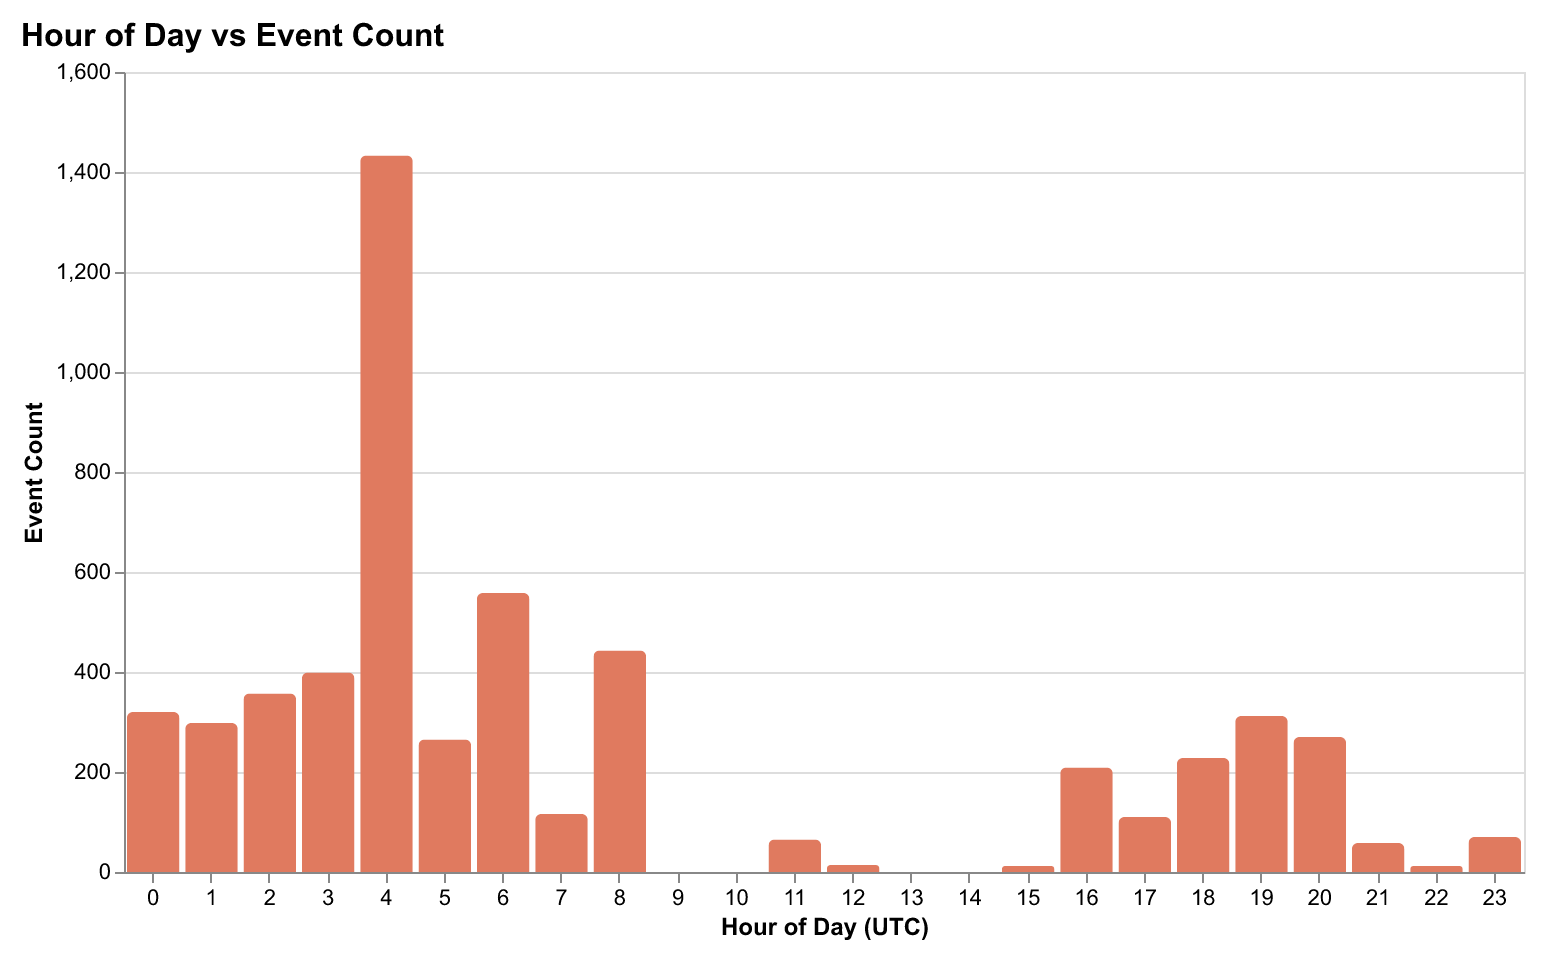
Activity Patterns
Analysis of captured data reveals distinct patterns in developer workflows:
Session Characteristics
Session-level metrics provide insights into development patterns and workflow complexity:
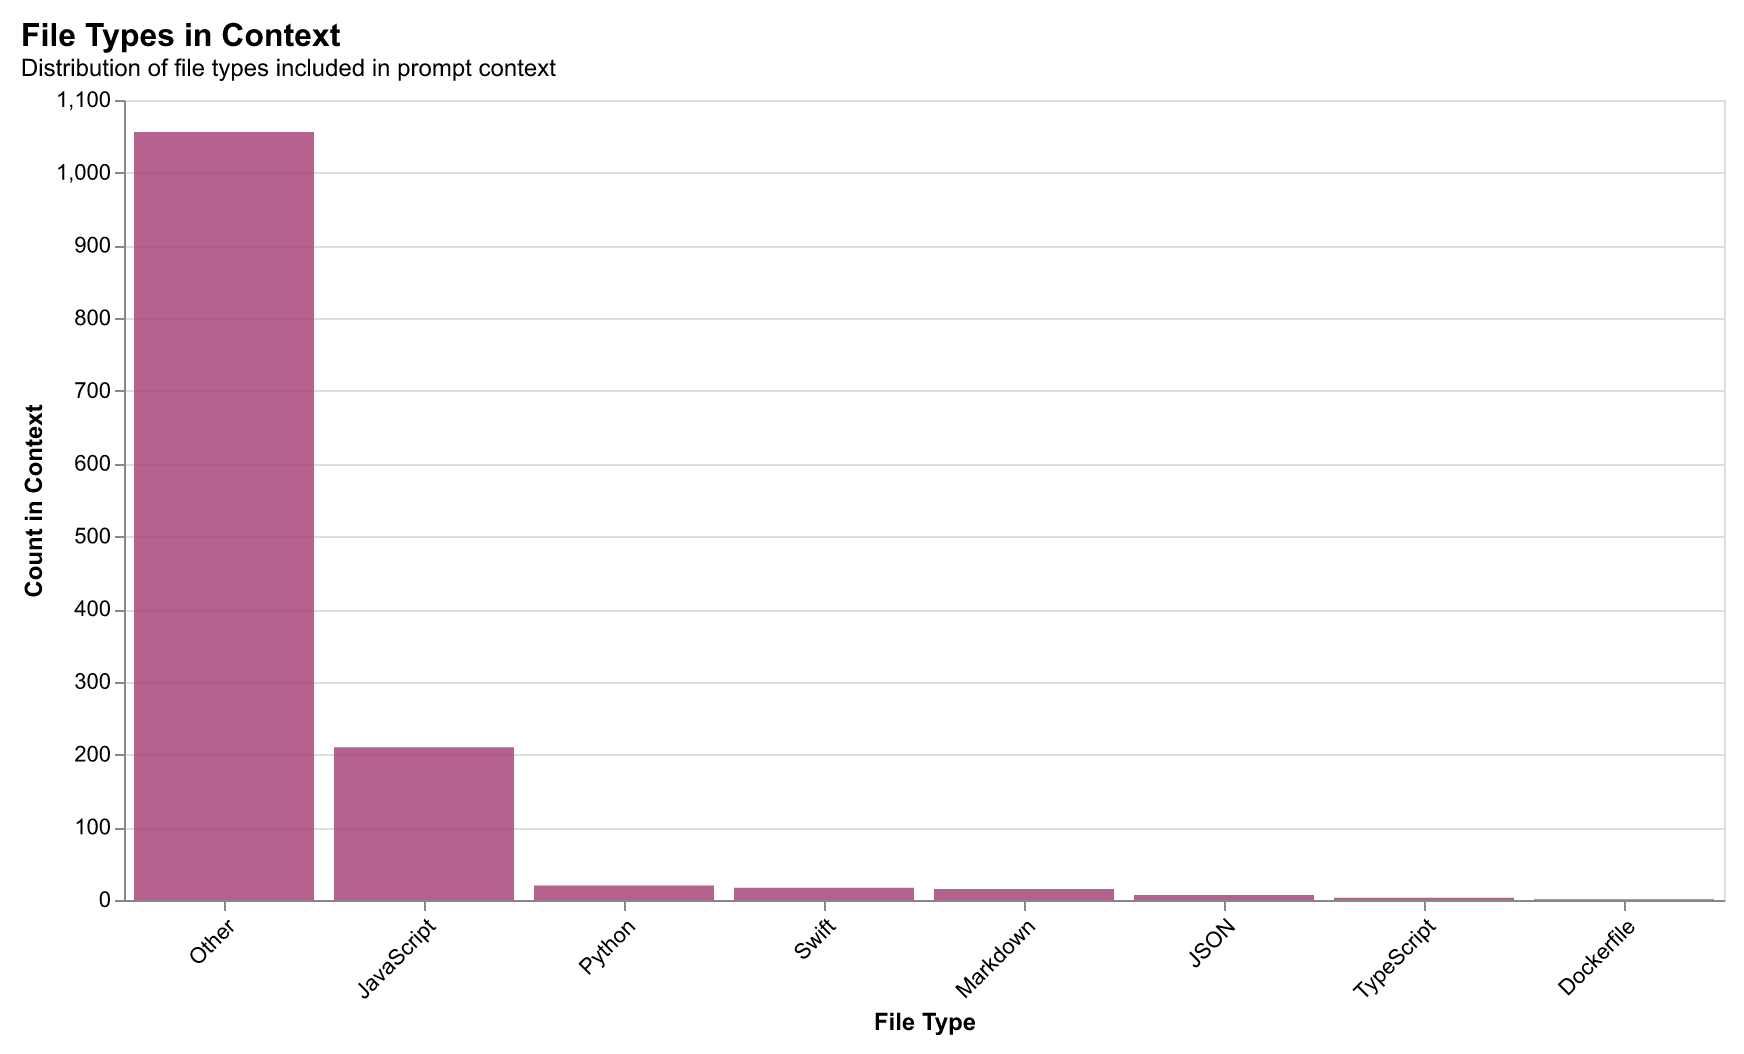
Context Window Usage
Understanding how developers utilize AI context windows reveals optimization opportunities:
The Representation Ladder
Six rungs progressively compress traces from raw events to high-level workflow patterns—each trading detail for privacy.
The ladder moves from Raw Traces (full fidelity, high privacy risk) through Tokens, Semantic Edits, and Functions, up to Motifs—high-level workflow patterns that achieve 98.4% classification accuracy with 242× compression and near-zero privacy risk.
We’ve designed six representation rungs that progressively abstract developer traces from raw code to high-level workflow patterns. Each rung represents a different point on the privacy-expressiveness frontier:
1. Tokens — Raw token-level representation with PII redaction. Captures exact text changes but offers the lowest privacy. Best for: Maximum fidelity when privacy isn’t a concern.
{"type": "edit", "file": "api.py", "tokens": ["def", "fetch_user", "(", "id", ")", ":"]}2. Semantic Edits — AST-based edit operations. Captures intent without raw code. Best for: Understanding what changed without seeing how.
{"type": "ADD_FUNCTION", "file": "api.py", "name": "fetch_user", "params": 1}3. Functions — Function signatures and module-level changes. Abstracts away implementation details. Best for: API-level analysis and cross-project comparison.
{"module": "api", "functions": ["fetch_user", "update_user"], "calls": 3}4. Files — File-level collaboration graph with action counts. Best for: Understanding project structure and hotspots.
{"file": "api.py", "edits": 12, "navigations": 8, "context_uses": 5}5. Dependencies — Dependency graph capturing import relationships. Best for: Architectural analysis and coupling detection.
{"source": "api.py", "imports": ["utils.py", "models.py"], "weight": 0.8}6. Motifs — Workflow patterns and high-level sequences. Highest abstraction, workflow-level patterns only. Best for: Privacy-preserving search and cross-codebase learning.
{"motifs": ["CYCLE_a13f_10c9", "HOT_a13f_3", "T_a13f_10c9"]}Privacy metrics approximate differential privacy and k-anonymity, giving users clarity about what each rung reveals. This allows users to choose the appropriate abstraction level for their use case while understanding the privacy-expressiveness trade-off.
Performance Comparison
The following table summarizes key performance metrics across the abstraction rungs. Note that different metrics measure different capabilities: Accuracy measures intra-trace classification (within a single trace), while Recall@5 measures inter-trace retrieval (finding similar traces across the dataset).
| Rung | Compression | Classification Accuracy | Retrieval Recall@5 | Privacy Risk |
|---|---|---|---|---|
| Raw Traces | 1× | 100% | 61.2% | Critical |
| Tokens | 4.2× | 99.1% | 58.4% | High |
| Semantic Edits | 12× | 98.5% | 53.1% | Medium |
| Motifs | 242× | 98.4% | 42.8% | Near-Zero |
Key insight: Motifs excel at classification tasks (intra-trace) but trade off some retrieval performance (inter-trace). This creates a privacy-utility frontier where you can optimize for privacy (motifs) or utility (raw), with semantic edits offering a middle ground.
Technical note: Higher compression means lower information entropy (fewer bits to represent the same activity). Raw traces have ~8.2 bits of entropy per event while motifs have ~2.1 bits—a 4× reduction in information content that directly corresponds to privacy gain.
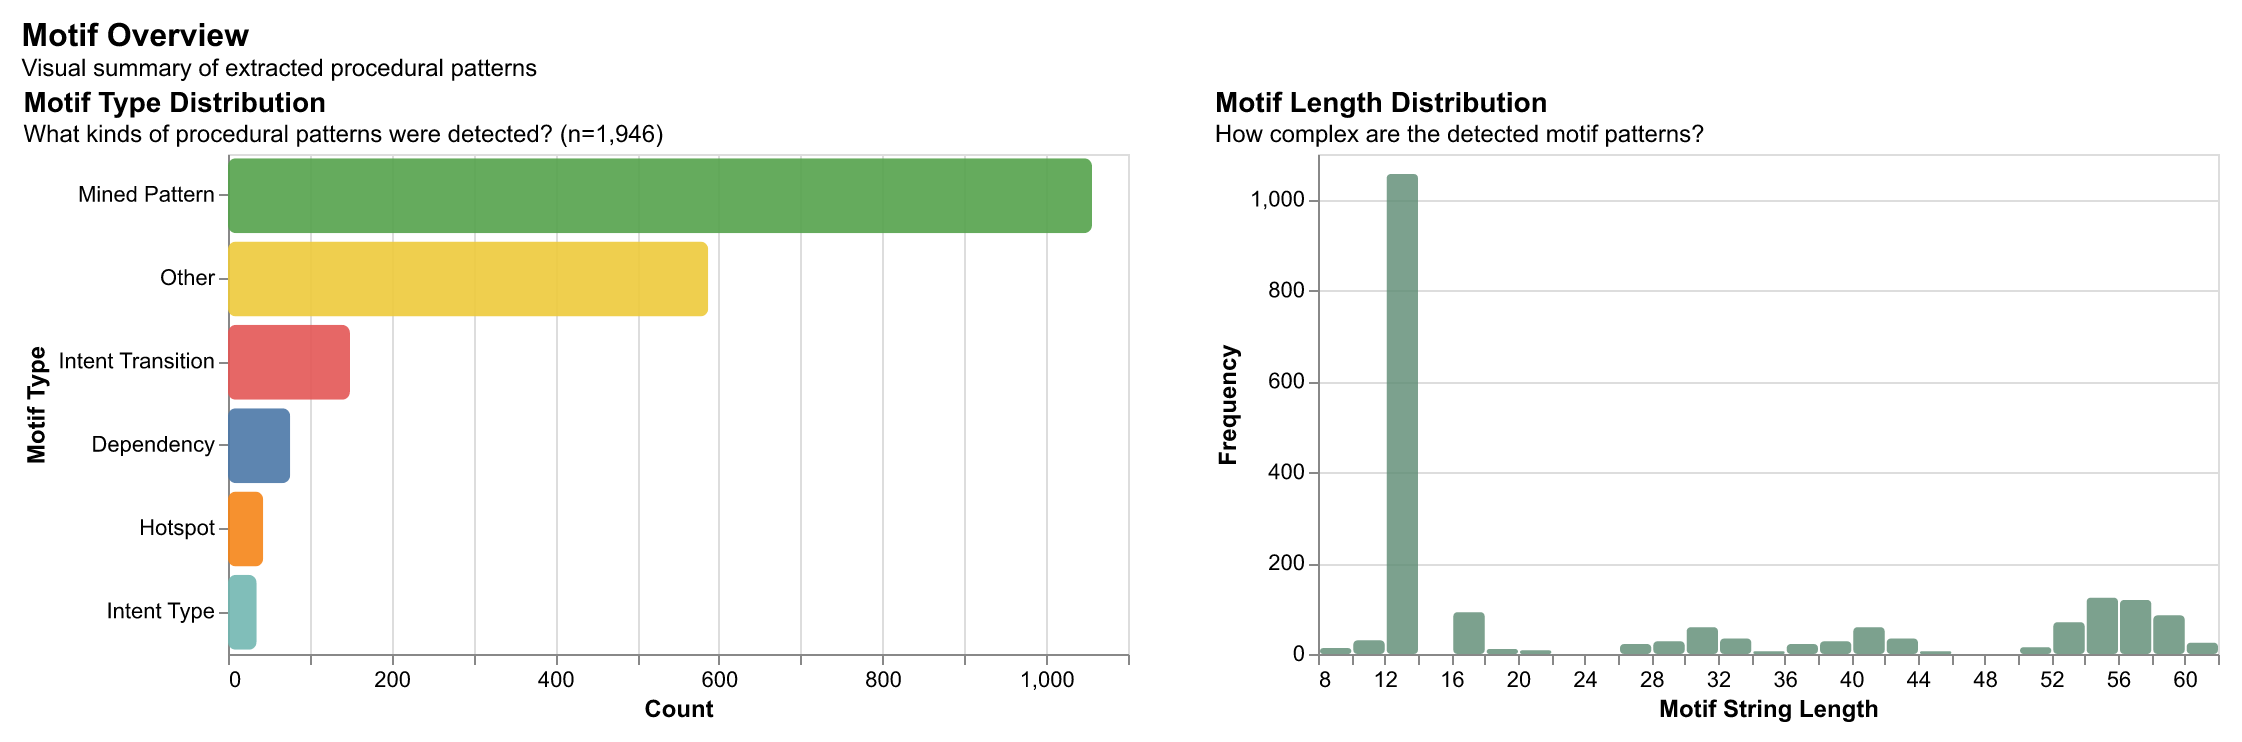
What are Motifs?
Motifs are high-level workflow patterns extracted from developer activity sequences. They capture recurring procedural patterns—like how developers navigate files, switch between tasks, or iterate on code—without exposing sensitive implementation details. By applying statistical sequence mining techniques, we transform raw event traces into compressed, privacy-preserving representations that preserve the essential structure of how work gets done.
Motifs are extracted using a universal approach that works across different abstraction levels (tokens, semantic edits, functions, module graphs). The extraction process uses statistical methods including PrefixSpan for frequent sequence mining, Sequitur for compression rules, and structural analysis for cycles and hotspots.
Concrete Example: From Raw Events to Motifs
Consider a developer working on a feature: they open an API file, add a function, switch to a utils file, add another function, then return to the API file to refactor. This workflow contains several patterns:
# Raw trace (13,712 bytes)
trace = {
    'events': [
        {'type': 'file_open', 'path': 'src/api.py', 'timestamp': '...'},
        {'type': 'edit', 'action': 'add_function', 'diff': '...', ...},
        {'type': 'file_open', 'path': 'src/utils.py', 'timestamp': '...'},
        {'type': 'edit', 'action': 'add_function', 'diff': '...', ...},
        {'type': 'file_open', 'path': 'src/api.py', 'timestamp': '...'},
        {'type': 'edit', 'action': 'refactor', 'diff': '...', ...},
    ]
}

# Motif representation (57 bytes - 242× compression)
motifs = [
    'T_EV_a13f92_EV_10c99d',           # Transition: api → utils
    'CYCLE_EV_a13f92_EV_10c99d',       # Cycle pattern: back-and-forth
    'PREFIXSPAN_EV_a13f92_EV_10c99d',  # Frequent sequence
    'HOT_EV_a13f92_3',                  # Hotspot: 3 edits in api.py
]

# These motifs preserve the workflow structure:
# - File switching pattern (api ↔ utils)
# - Iterative refinement (returning to api.py)
# - Hotspot editing (multiple edits in one file)
# Without exposing: file paths, code content, or implementation details
Why this matters: These motif representations enable privacy-preserving search and analysis. You can find similar workflows across different codebases without exposing the actual code or file paths. The patterns capture the how and why of development activity—that a developer iterated between two files, that they made multiple edits in one location, that they followed a back-and-forth pattern—making them valuable for building better AI coding assistants and understanding cumulative software engineering practices.
Real-world application: A developer working on a new feature can search for similar workflows: "Find workflows where developers iterated between API and utility files." The system returns matching patterns without revealing what code was written or which files were involved, enabling learning from others' approaches while preserving privacy.
Key insight: You can trade away verbosity and detail without losing most useful predictive power—privacy-preserving abstractions don't necessarily sacrifice utility for downstream learning. Different tasks require different levels of detail, enabling personalized, privacy-preserving code recommendation systems.
Change Propagation & Virality
Changes spread through codebases like information diffusion in social networks. We model this behavior using cascade analysis.
Changes spread through codebases like information diffusion in social networks. When a file is modified, related files often follow—creating cascades that reveal architectural coupling, dependency relationships, and workflow patterns.
Our analysis of 40,000+ developer sessions reveals that code changes propagate through predictable network structures. By modeling this propagation, we can identify which files act as “super-spreaders,” predict cascade patterns, and understand how architectural decisions shape development workflows.
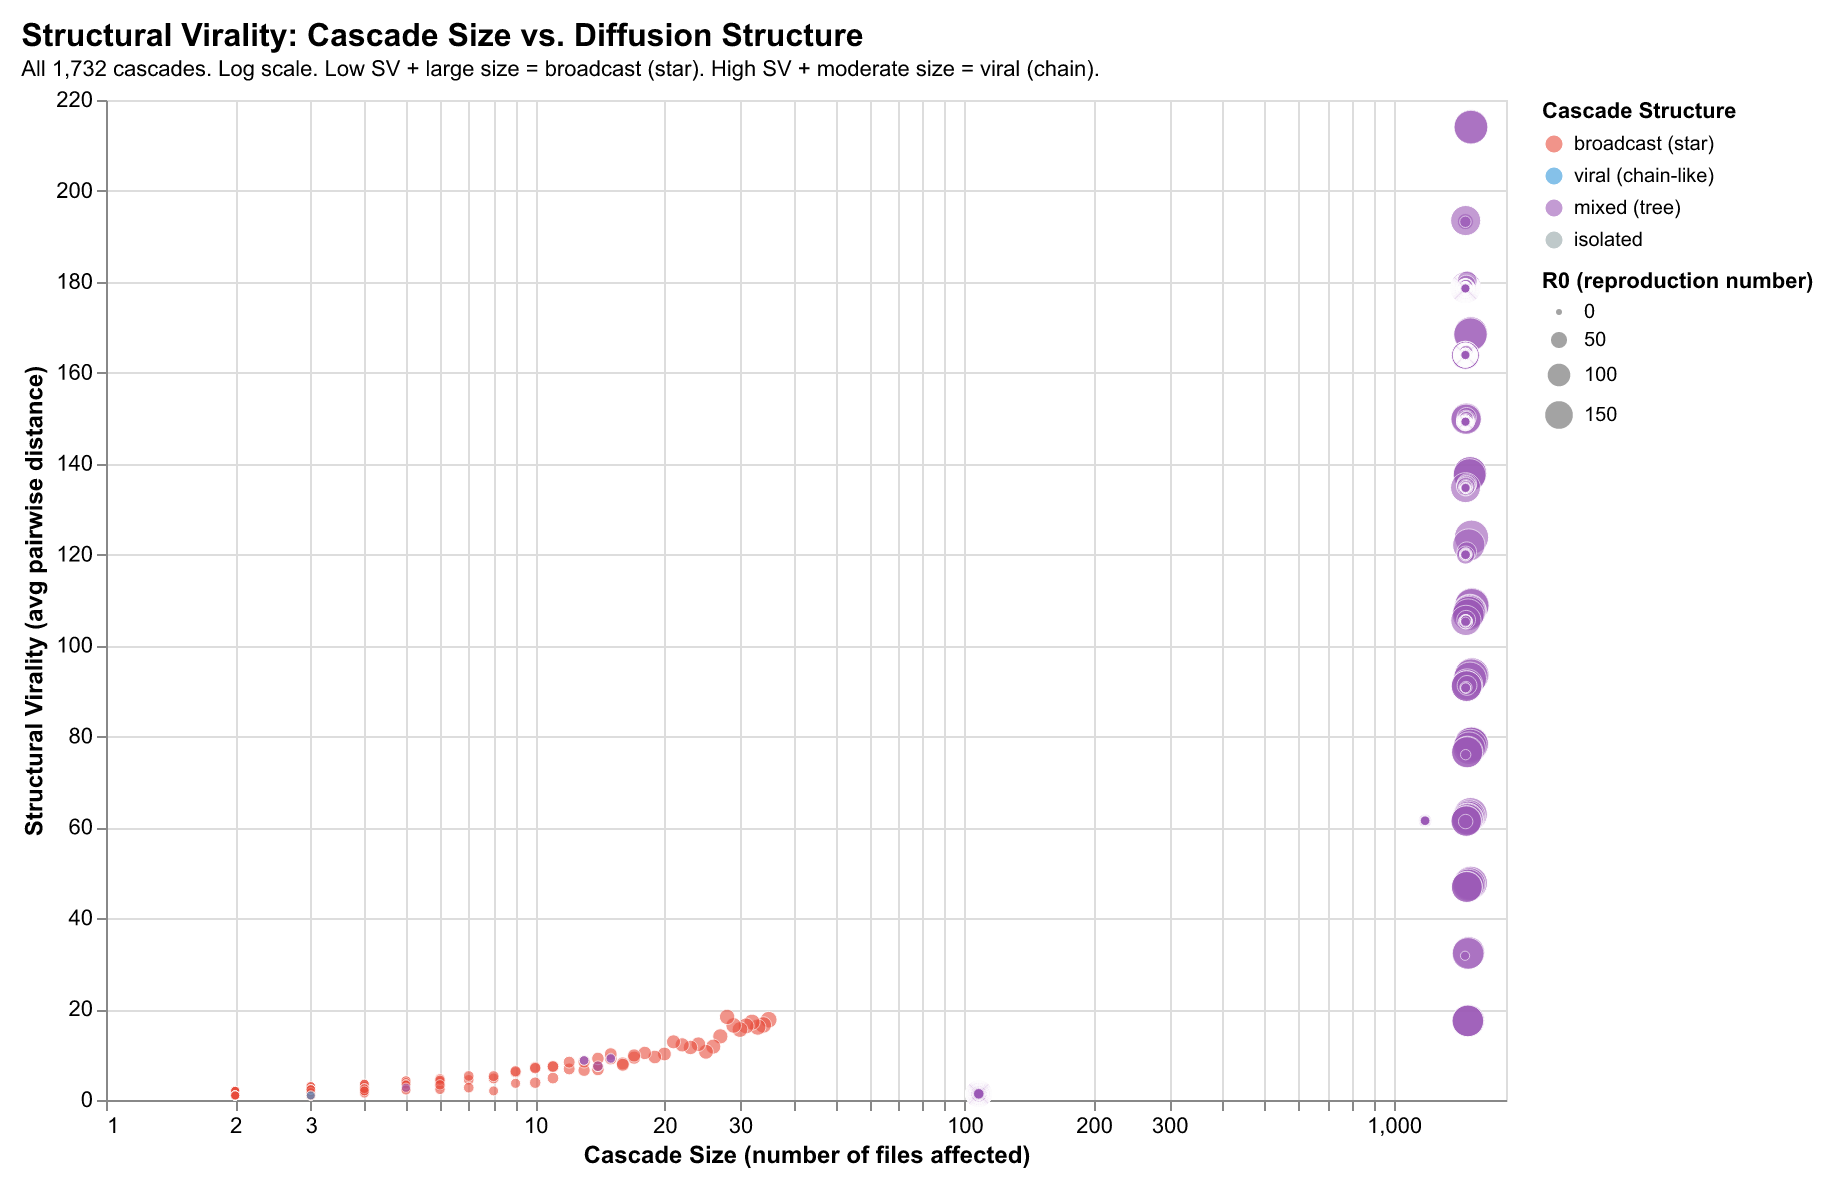
Structural Virality
We model change propagation as a directed graph: an edge from File A to File B indicates B changed within a time window after A. This reveals distinct cascade structures:
Star Patterns (Low depth, high breadth)
Configuration files, shared utilities—one change triggers many immediate downstream changes. High R₀, low cascade depth.
Chain Patterns (High depth, low breadth)
Refactoring sequences, dependency updates—changes propagate through a sequence A→B→C→D. Lower R₀, high cascade depth.
Tree Patterns (Balanced)
Interface changes, feature implementations—hybrid patterns with branching at each level.
Key Metrics
| Metric | Definition | Finding |
|---|---|---|
| R₀ | Average files affected per change | ~2.1 (changes spread to 2+ downstream files) |
| Cascade Depth | Maximum hops from initial change | Config: 1-2, Refactor: 3-5, Features: 2-3 |
| Structural Virality | Avg pairwise distance in cascade tree | Distinguishes broadcast vs viral patterns |
| Small-World σ | Clustering coefficient / path length ratio | σ > 1 for 65% of cascades (modular propagation) |
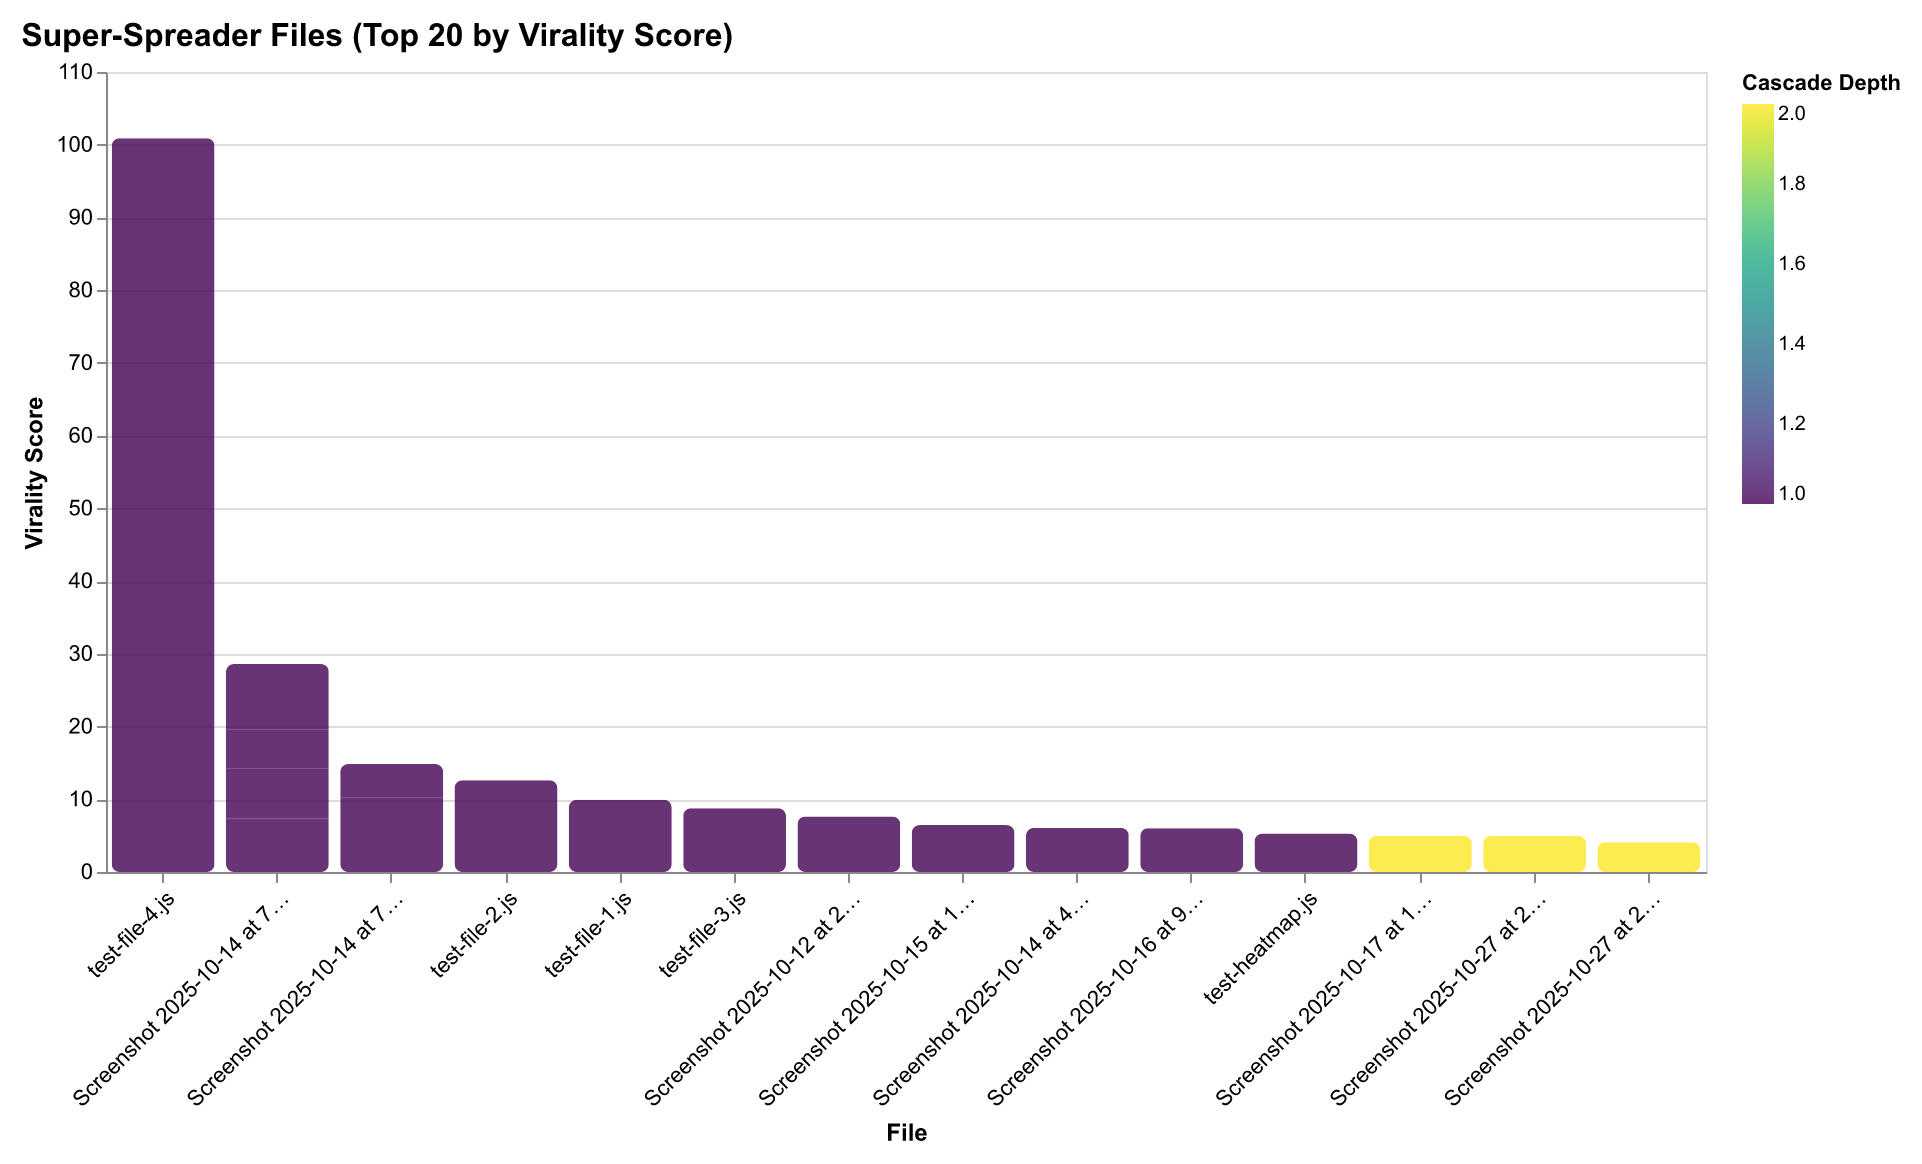
Super-Spreader Files
Some files trigger disproportionately many downstream changes:
- Configuration files (
.env,config.json,tsconfig.json) — broadcast to many consumers - Shared utilities (
utils.js,helpers.py) — imported widely - Database schemas — cascades through ORM layers
- Type definitions — propagates through dependent modules
Small-World Properties
Following Watts & Strogatz, we measure whether cascade networks exhibit small-world properties:
- High clustering: Files that change together cluster in communities
- Short path lengths: Most files reachable within 2-3 hops
- σ > 1: Indicates modular propagation structure (65% of observed cascades)
This explains why certain architectural patterns resist change (high modularity Q ≈ 0.32) while others facilitate cascading effects.
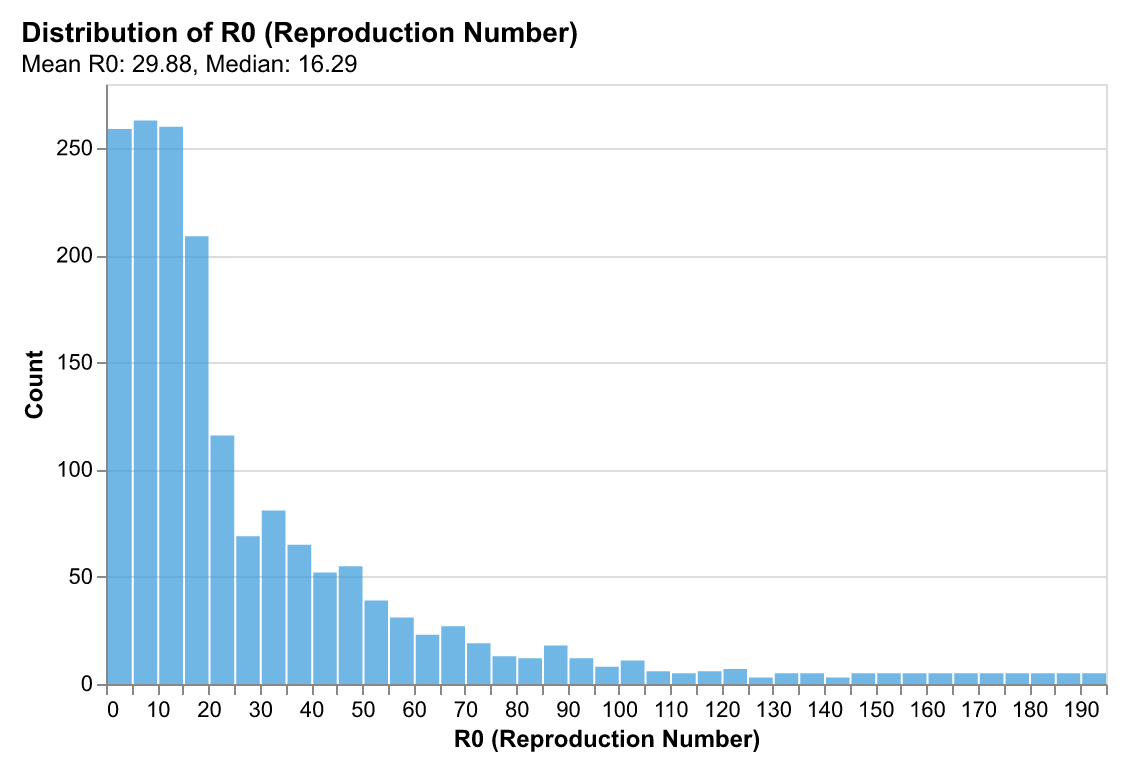
R₀ Distribution: Measuring Change Propagation
The reproduction number R₀ measures how many downstream files are affected on average by a change to a given file. Borrowed from epidemiology, R₀ > 1 indicates changes that spread (viral), while R₀ < 1 indicates changes that die out quickly.
Our analysis shows most files have R₀ ≈ 2.1, indicating moderate virality where changes spread to 2+ downstream files on average. This is higher than we might expect—it suggests that codebases are more interconnected than directory structures imply. Configuration files and shared utilities have R₀ > 5 (super-spreaders), while isolated feature files have R₀ < 1.
Implication: Understanding R₀ helps predict which files will trigger cascading changes. When modifying a file with high R₀, developers should expect downstream impacts and can proactively check related files. AI systems can use R₀ to prioritize context selection—files with high R₀ are more likely to be relevant.
Super-Spreader Files: Architectural Hubs
Some files trigger disproportionately many downstream changes. Configuration files (`.env`, `tsconfig.json`), shared utilities (`utils.js`, `helpers.py`), database schemas, and type definitions act as "super-spreaders" that broadcast changes widely through the codebase.
Why this matters: Super-spreader files are architectural hubs. Changes to these files require careful coordination because they affect many downstream components. Understanding which files are super-spreaders helps developers anticipate impact and plan changes accordingly. For AI systems, super-spreader files are high-value context—they're more likely to be relevant when working on related features.
Pattern: Super-spreaders tend to be files that are imported widely (utilities), define shared contracts (type definitions, schemas), or control system behavior (configuration). They create star-pattern cascades: one change triggers many immediate downstream changes, but with low depth (changes don't propagate further).
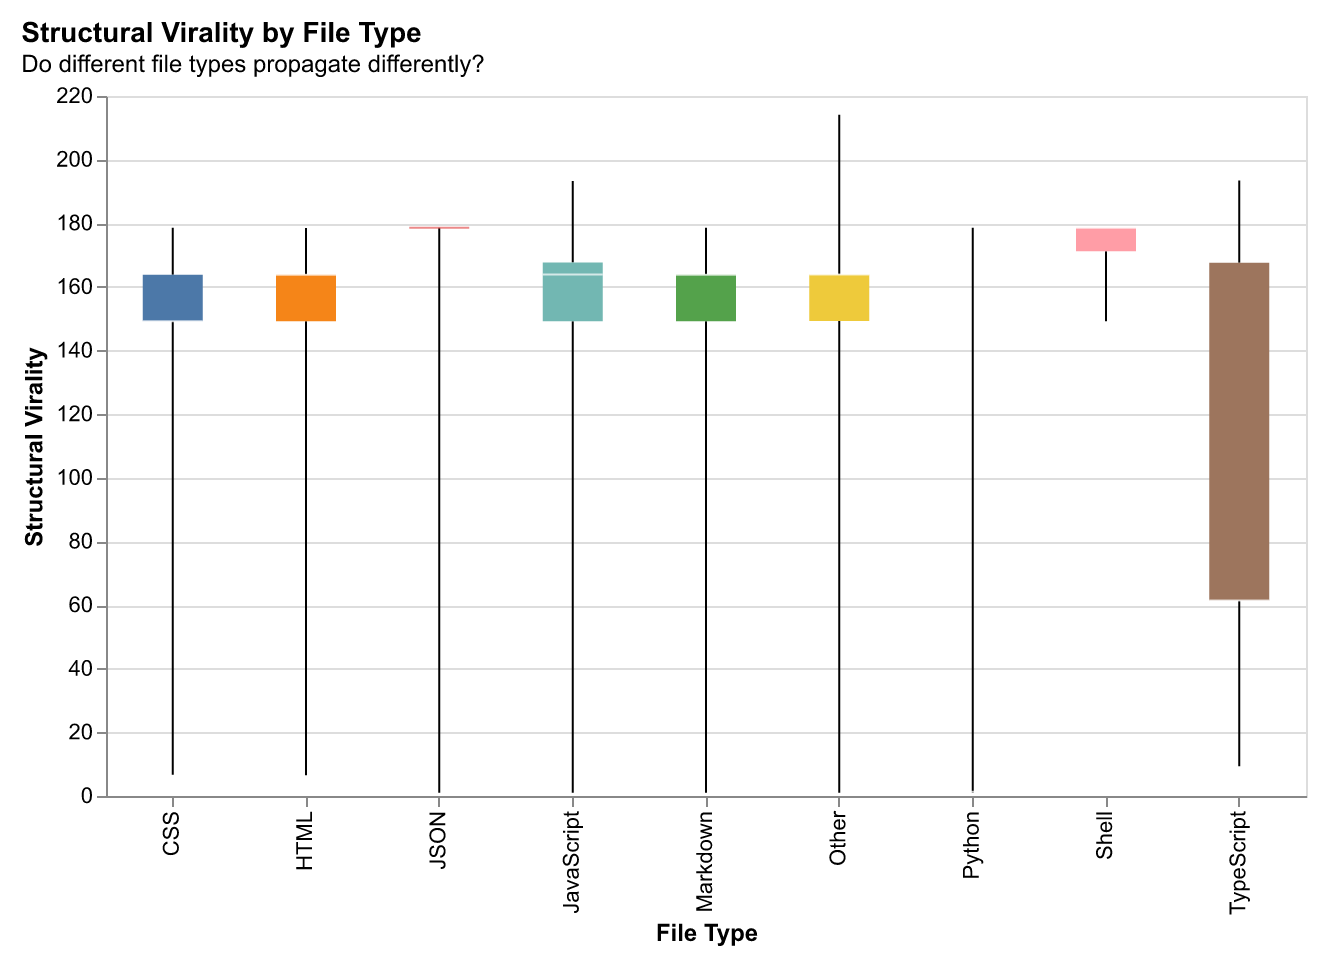
Structural Virality by File Type
Different file types exhibit different virality patterns. Understanding which file types propagate changes most effectively helps predict cascade behavior and optimize development workflows.
Architectural Coupling
Analyzing file co-occurrence reveals logical communities that transcend directory boundaries.
File co-occurrence analysis reveals which files are modified together in development workflows. This captures architectural coupling, module relationships, and emergent patterns in how developers navigate codebases.
From 114,822 file pairs across 2,101 unique files, we identify natural communities that reflect how developers actually work—not just how code is structured, but how it evolves together.
Discovery Approach
We build a co-modification graph where:
- Nodes represent files
- Edges connect files modified in the same session or time window
- Edge weights reflect frequency of co-modification
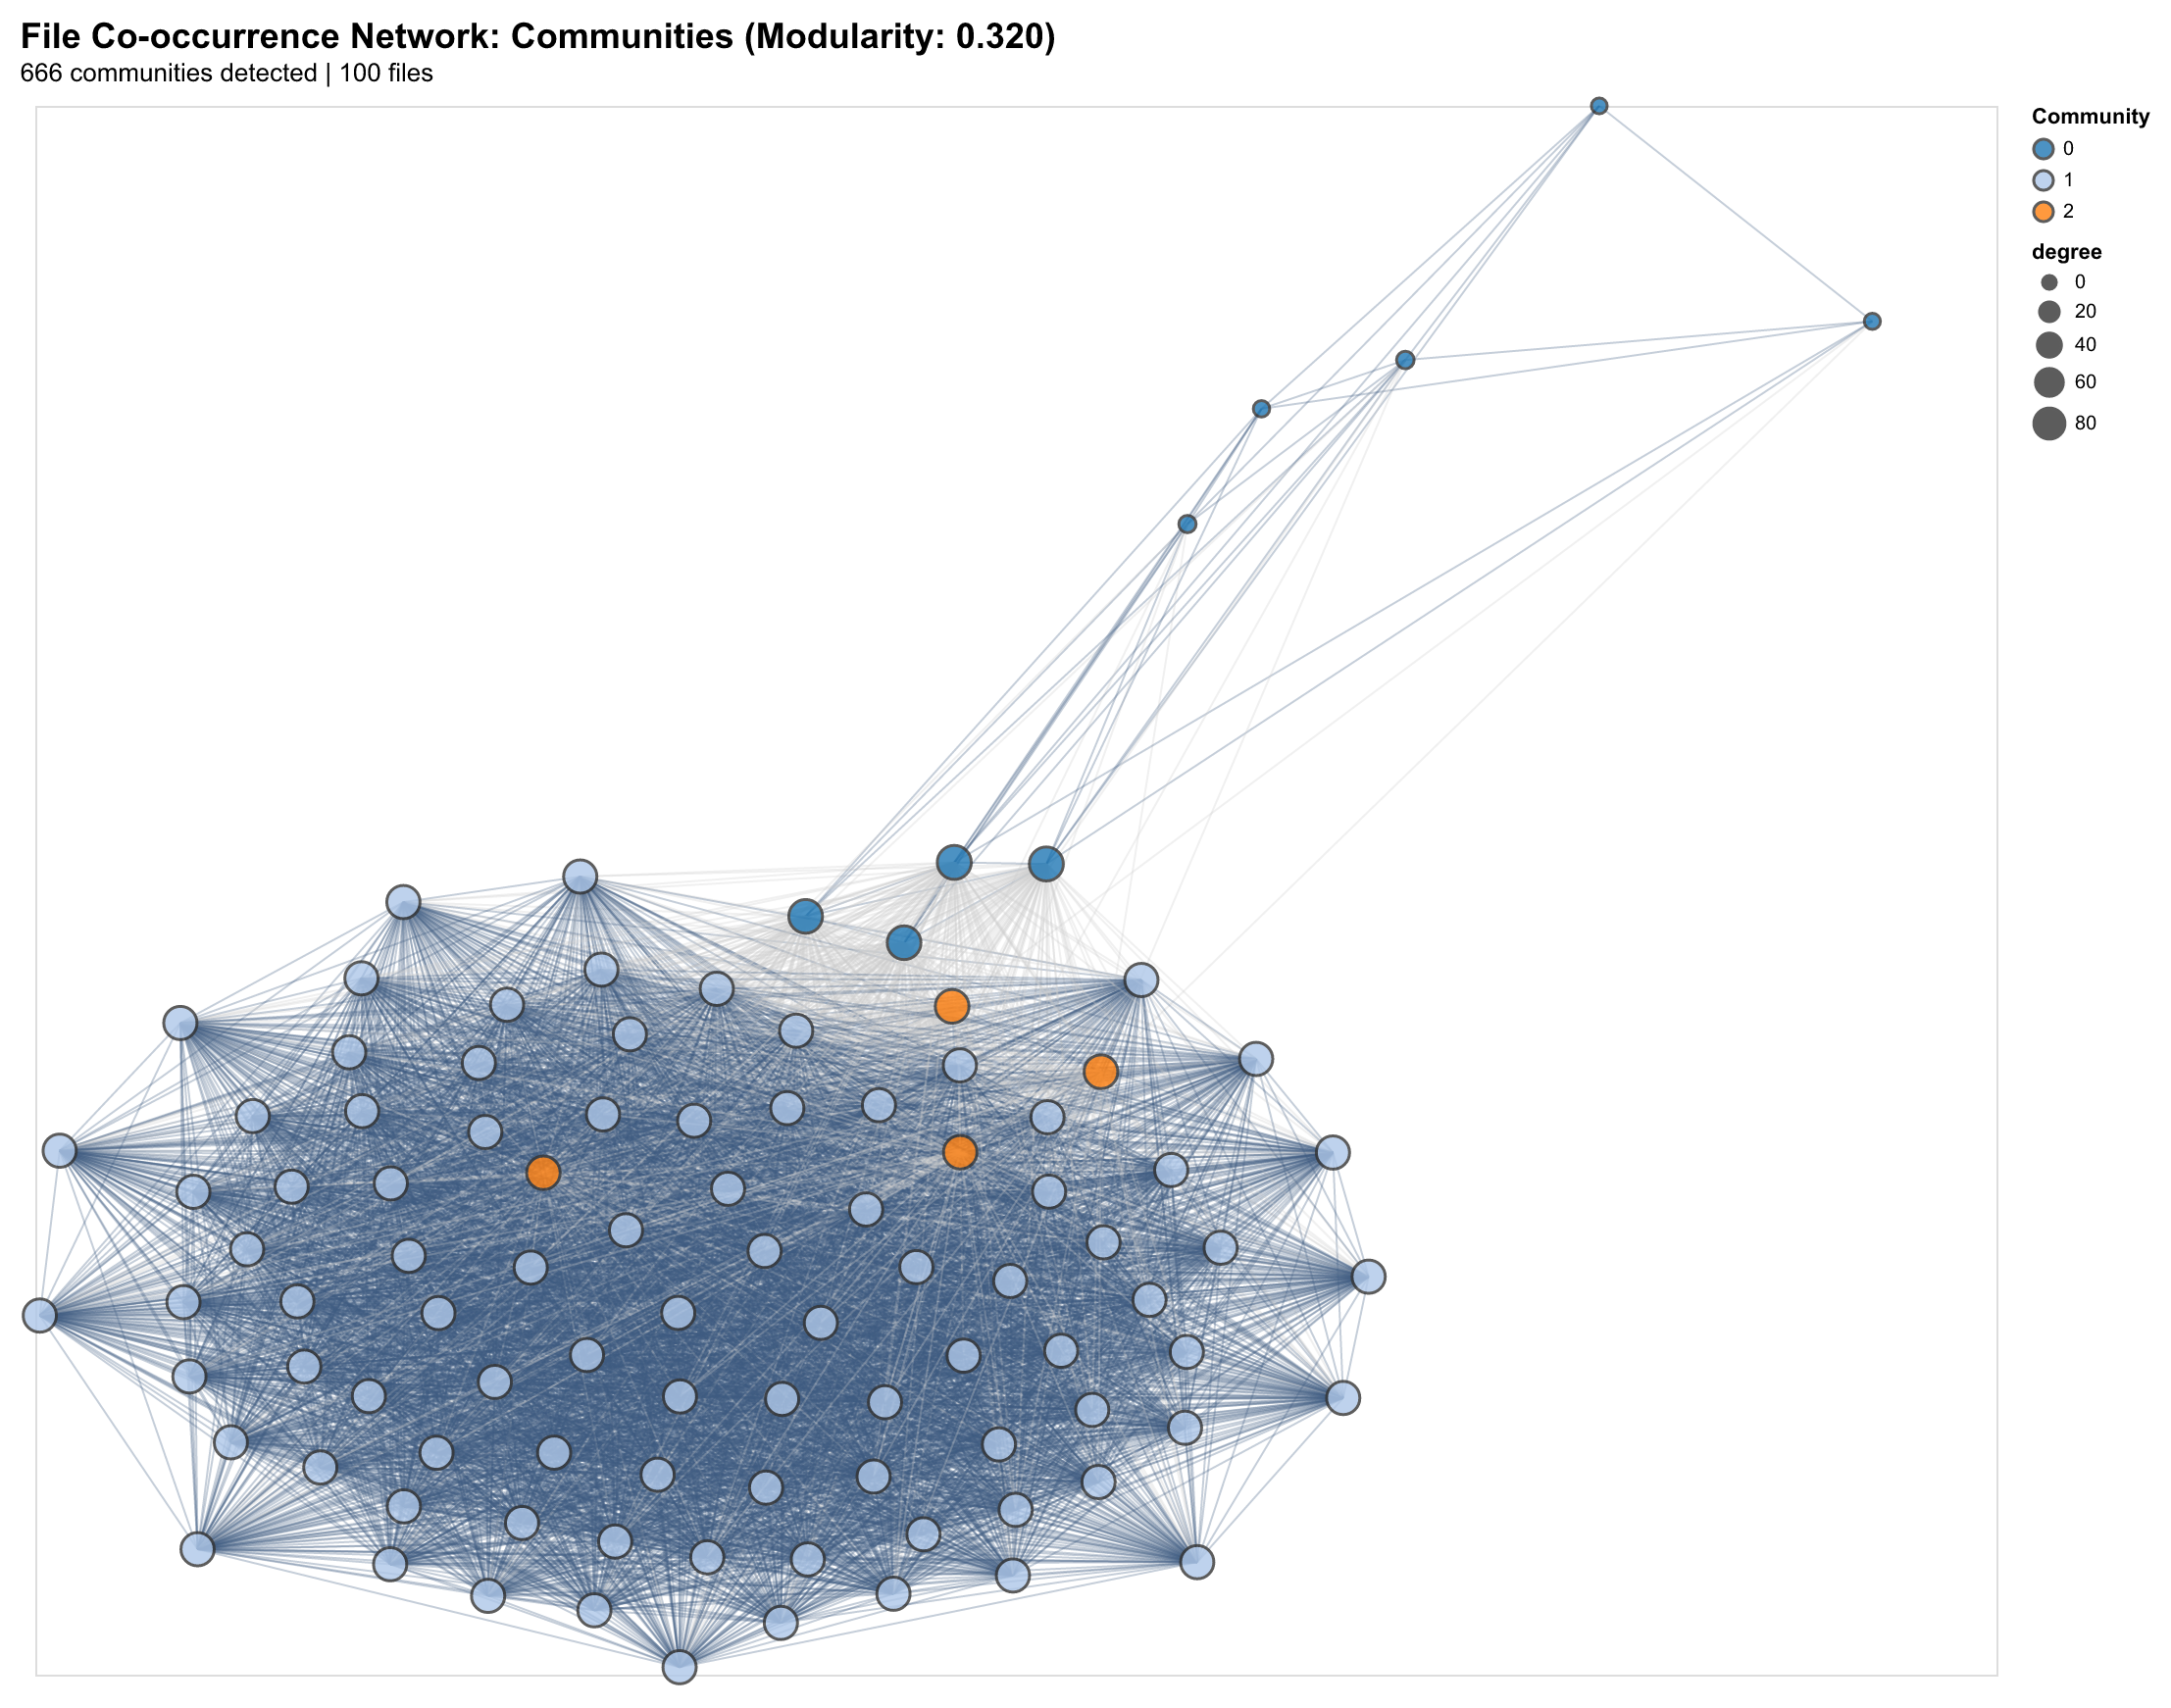
Community Structure
Applying community detection (Louvain algorithm) reveals natural clustering:
- Frontend clusters: Component files, styles, and tests that change together
- Backend clusters: API routes, database models, and business logic
- Infrastructure clusters: Configuration, CI/CD, and deployment scripts
- Cross-cutting clusters: Shared utilities that bridge architectural boundaries
The modularity score (Q ≈ 0.32) indicates strong community structure—most changes stay within architectural boundaries, with occasional cross-cluster changes through shared interfaces.
Language Coupling Patterns
Analysis reveals predictable cross-language coupling patterns that reflect real development workflows. The heatmap below visualizes the frequency of co-modification between different file types:
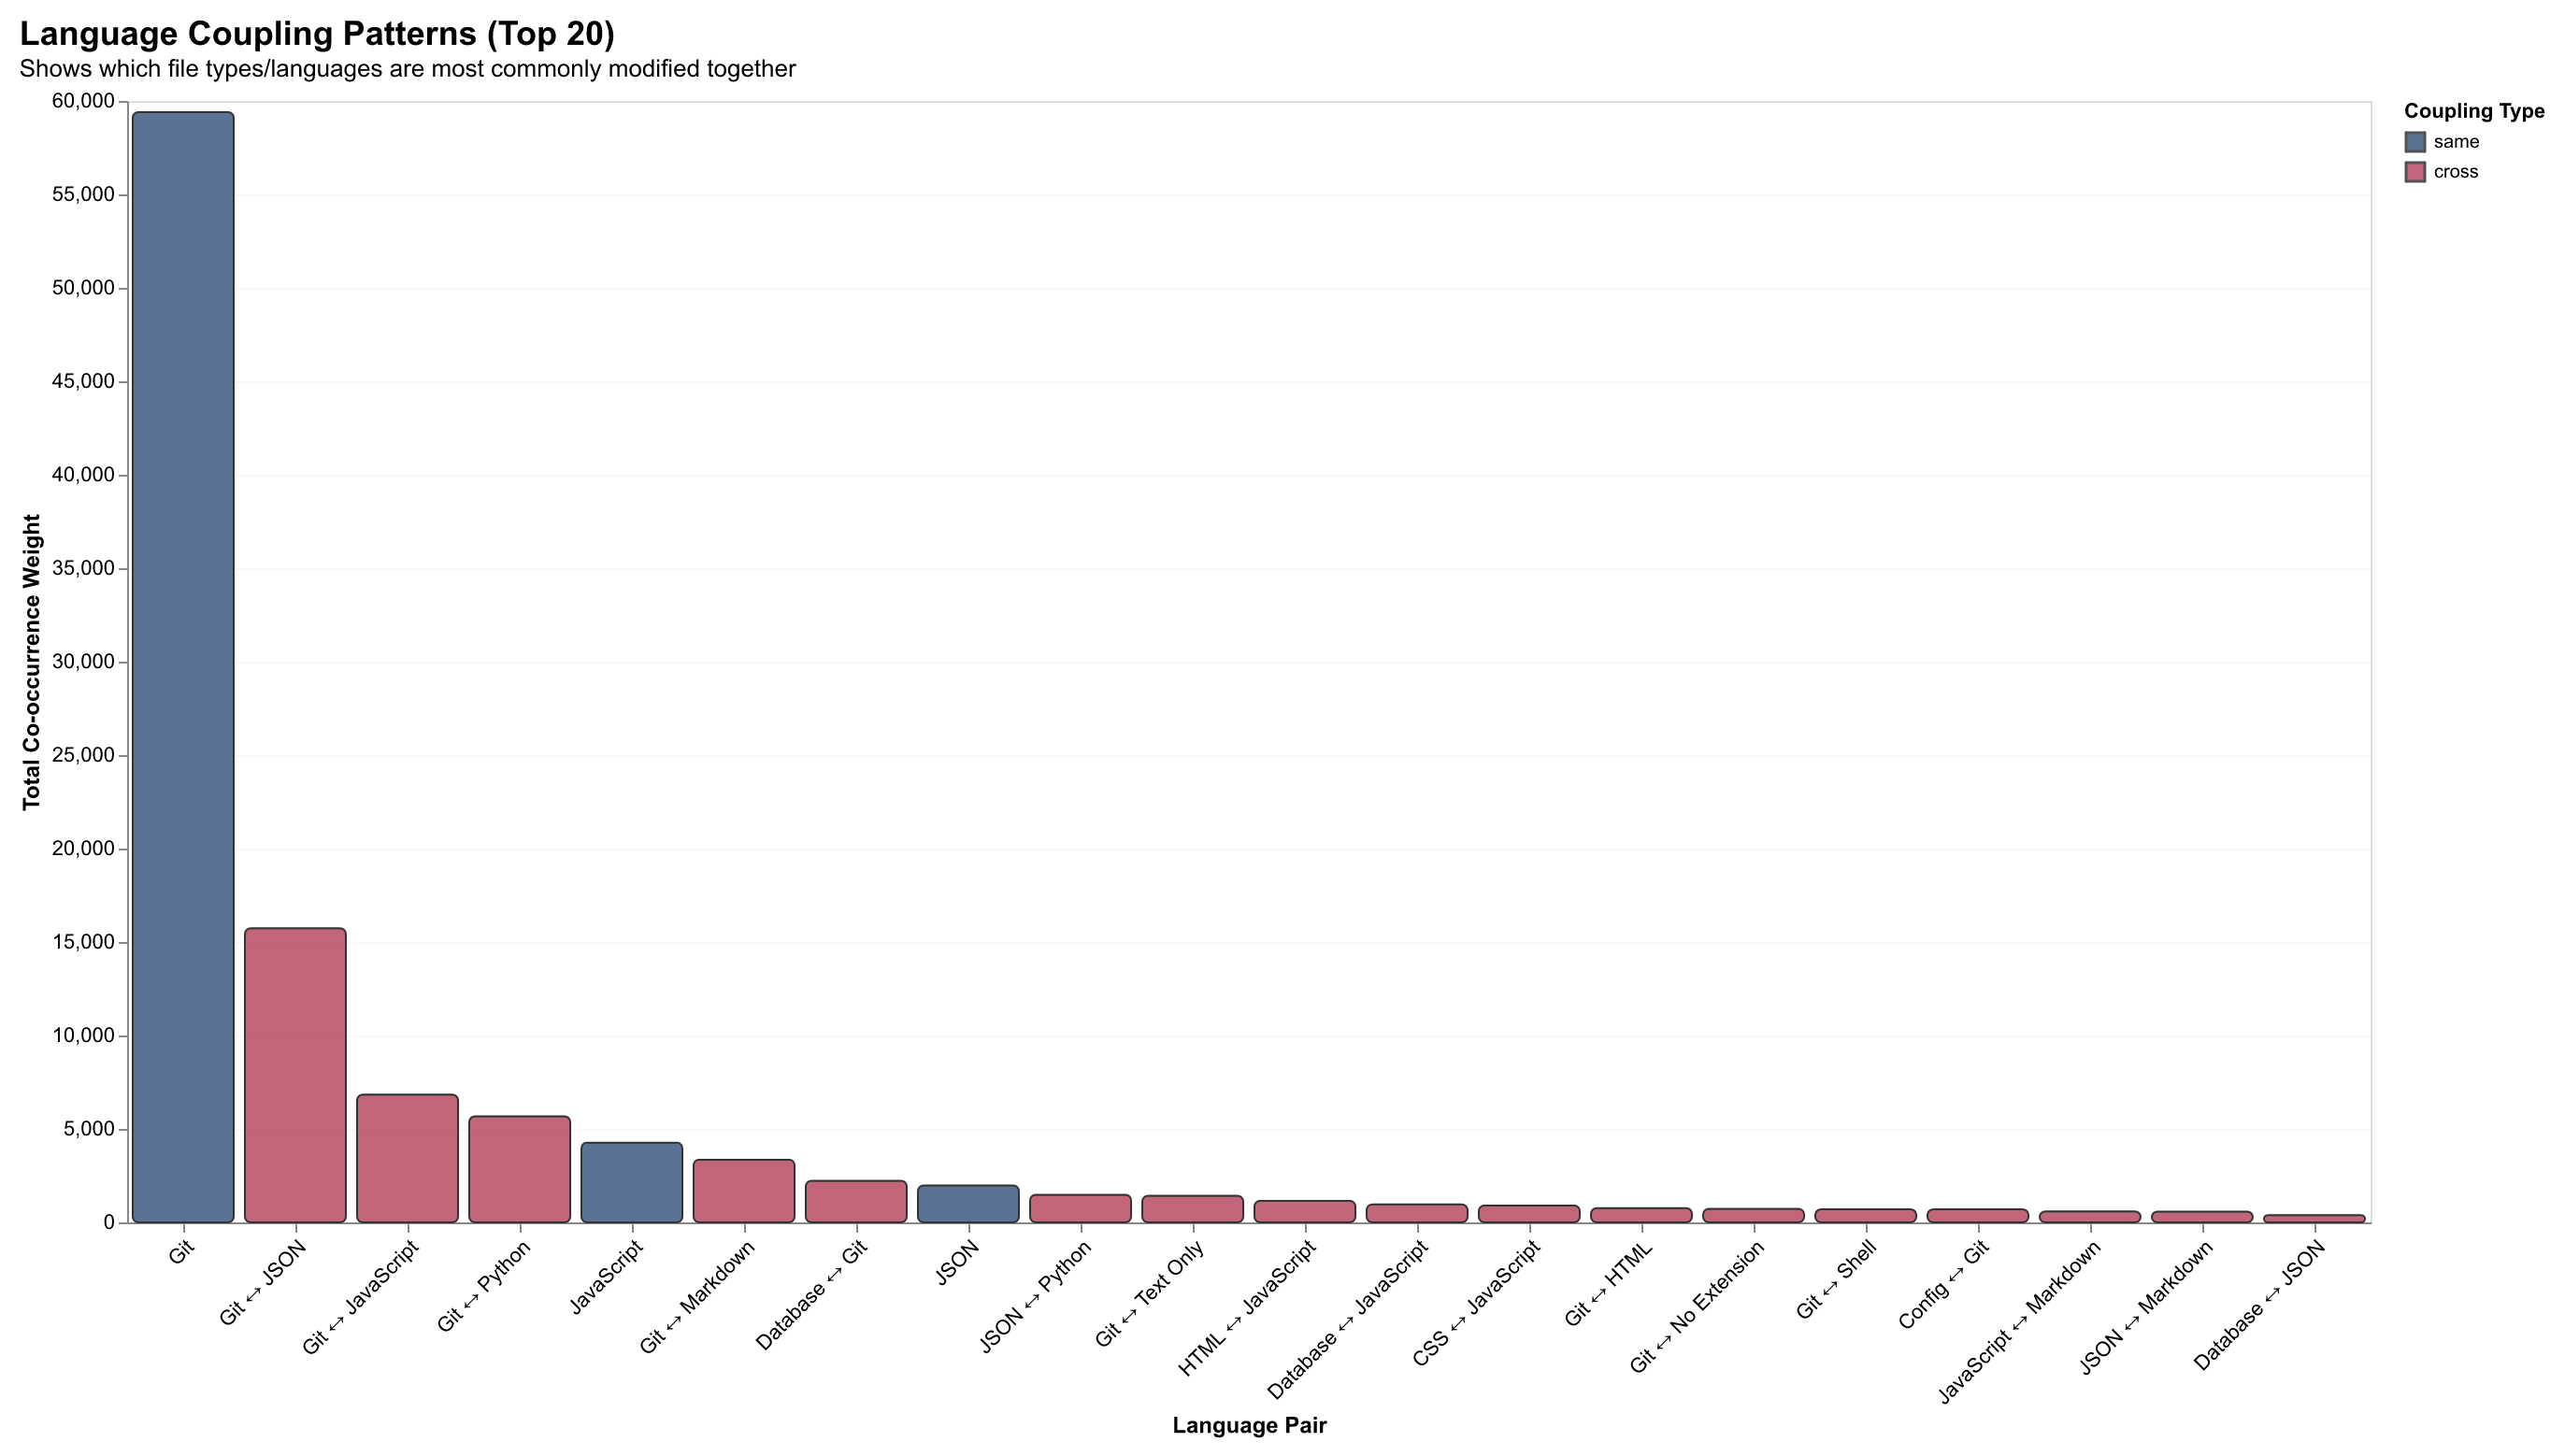
| Pattern | Example | Interpretation |
|---|---|---|
| TypeScript ↔ CSS | Component + styles | UI development workflow |
| Python ↔ YAML | Code + config | ML/data pipeline patterns |
| JavaScript ↔ JSON | Code + package.json | Dependency management |
| SQL ↔ TypeScript | Schema + ORM models | Database-driven development |
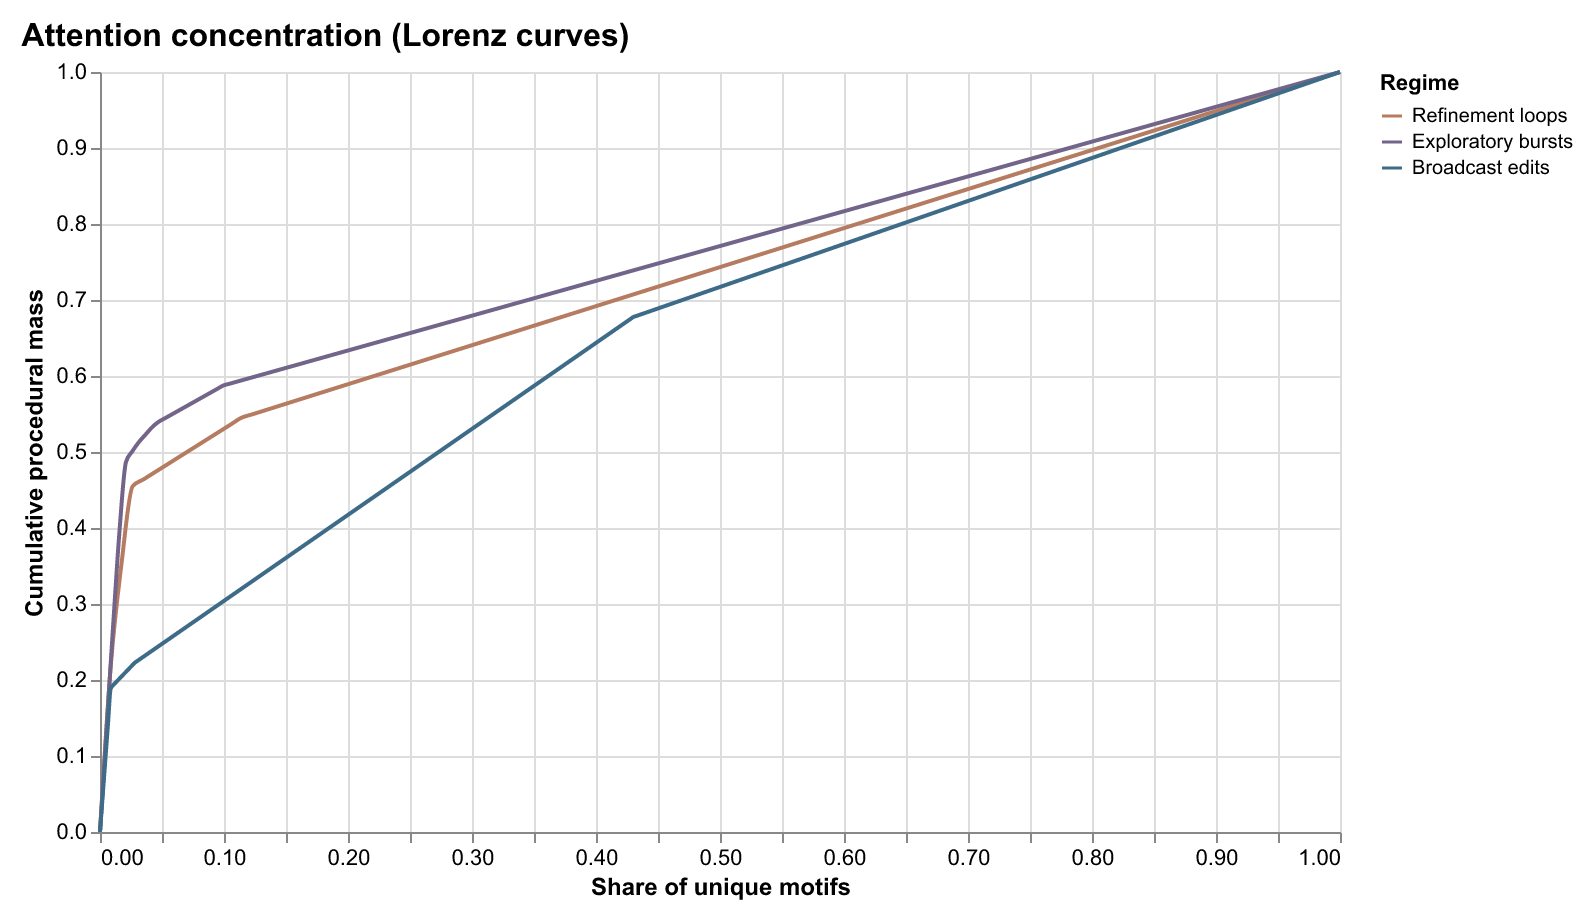
Attention Concentration
The Lorenz curve of file modification frequency reveals high concentration:
- Top 10% of files account for 60%+ of all modifications
- A small number of “hub” files see constant activity
- Long tail of rarely-modified files (documentation, tests, legacy code)
This inequality shapes how developers allocate attention and where AI assistance provides the most value.
Implications for AI Coding Tools
Understanding file co-occurrence enables:
- Smarter context selection: When a file is opened, predict which related files should be in context
- Workflow prediction: Suggest next files to modify based on historical patterns
- Impact analysis: Estimate which files might be affected by a proposed change
- Onboarding support: Surface the “usual suspects” that change together
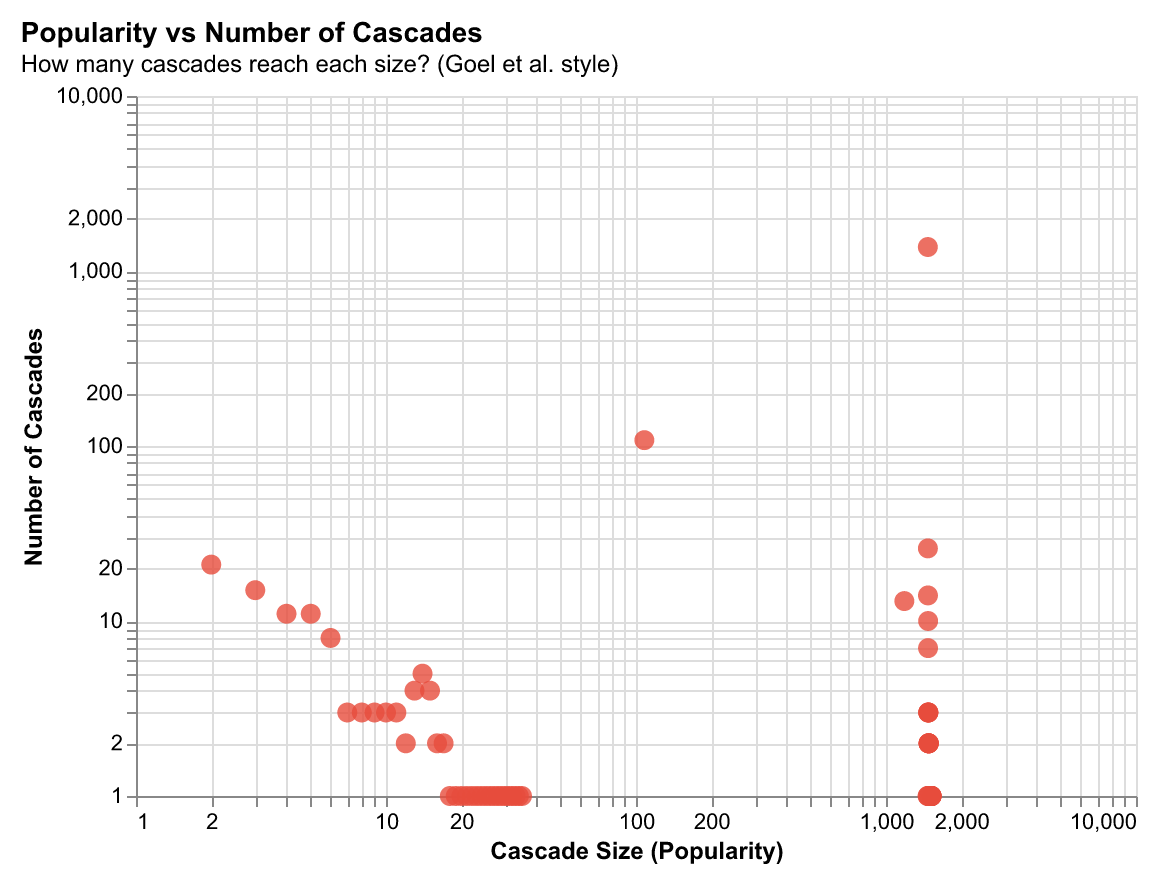
File Popularity and Cascade Involvement
Files that are frequently modified often play central roles in change cascades. This relationship between popularity and cascade involvement reveals which files are architectural hubs—files that are both actively developed and trigger downstream changes.
Finding: There's a positive correlation between how often a file is modified and how many cascades it participates in, but with interesting outliers. Some files are modified frequently but don't trigger cascades (isolated feature files), while others trigger cascades despite infrequent modification (shared interfaces, type definitions).
Implication: This helps identify files that need careful maintenance—files that are both frequently changed and trigger cascades require extra attention to avoid breaking downstream code. AI systems can use this to prioritize which files to include in context windows.
Attention Concentration: The 60/10 Rule
Development activity is highly concentrated: 60% of activity is concentrated in the top 10% of files. This follows a power-law distribution—a small number of "hot" files see constant activity, while most files are rarely modified.
Why this matters: This concentration pattern shapes how developers allocate effort and where AI assistance provides the most value. The hot files are where developers spend most of their time, where bugs are most likely to occur, and where improvements have the highest impact. Understanding which files are hot helps prioritize testing, documentation, and refactoring efforts.
Implication for AI: Context windows should prioritize hot files. When a developer opens a file, the system should predict which other hot files are likely to be relevant based on co-occurrence patterns. This enables smarter context selection that matches how developers actually work.
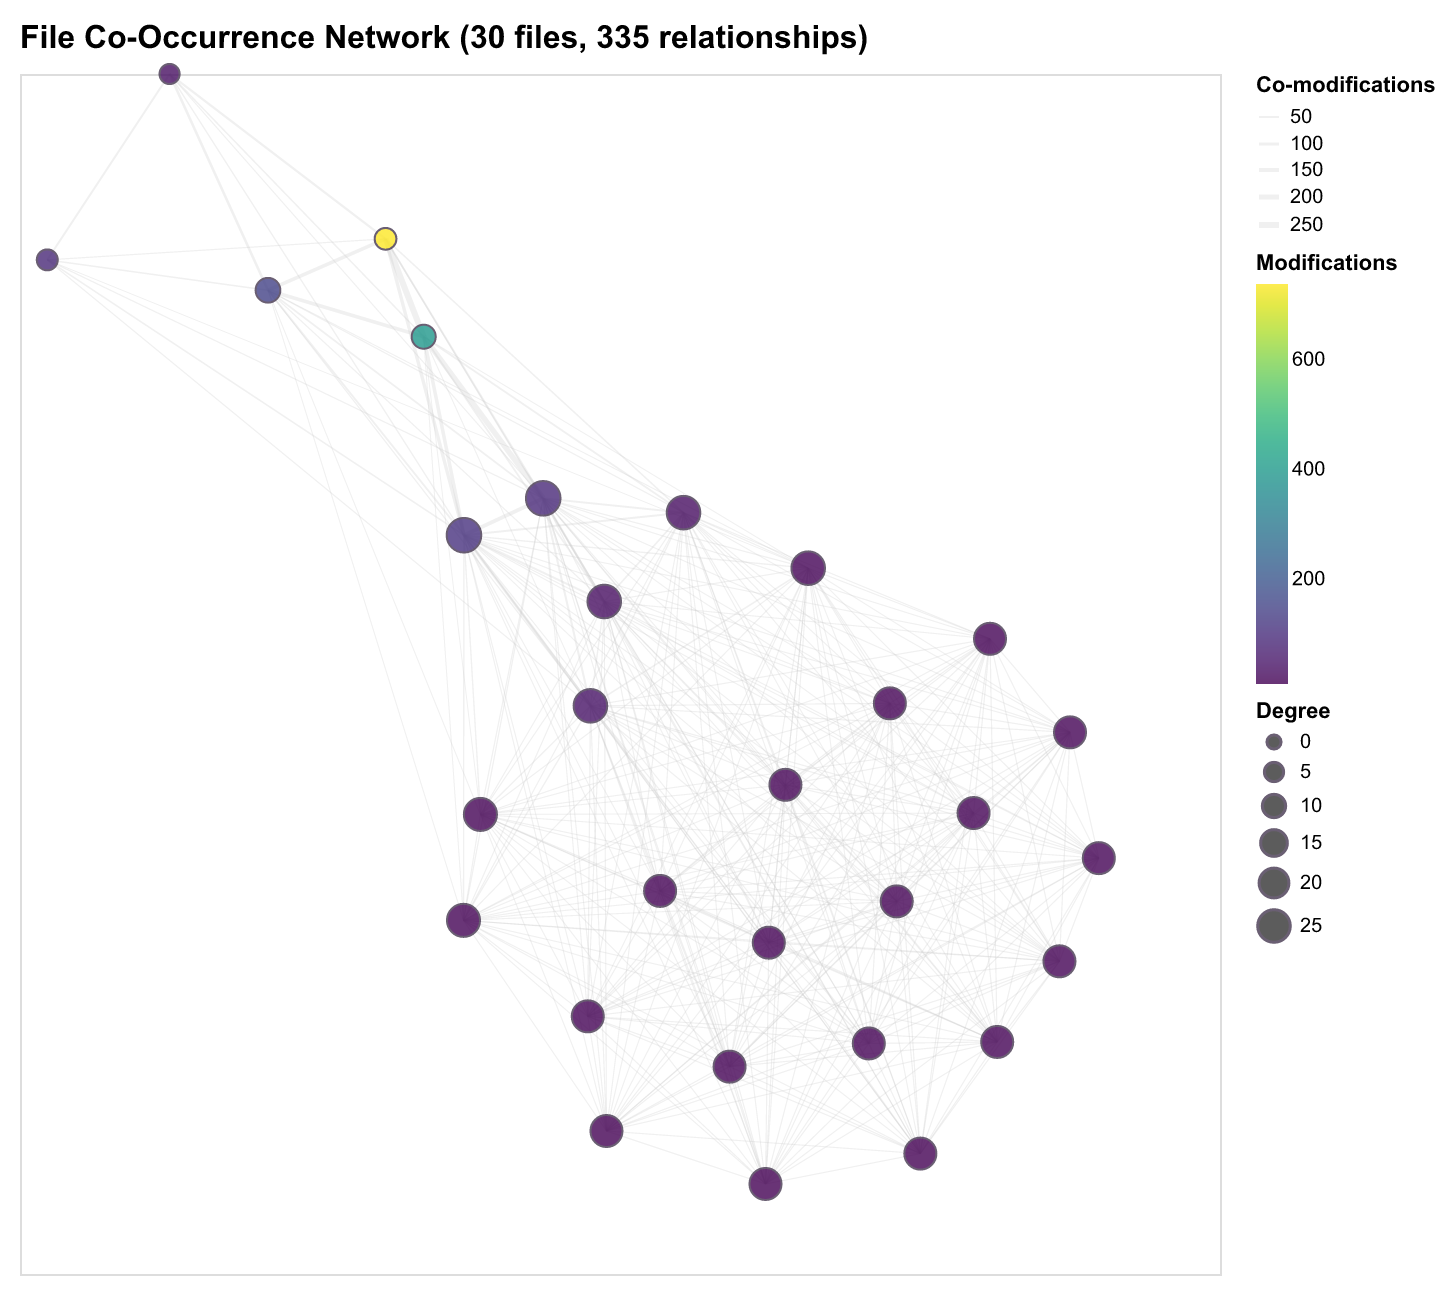
File Co-Occurrence Network
The co-occurrence network reveals natural communities of files that change together, reflecting architectural coupling and development workflows.
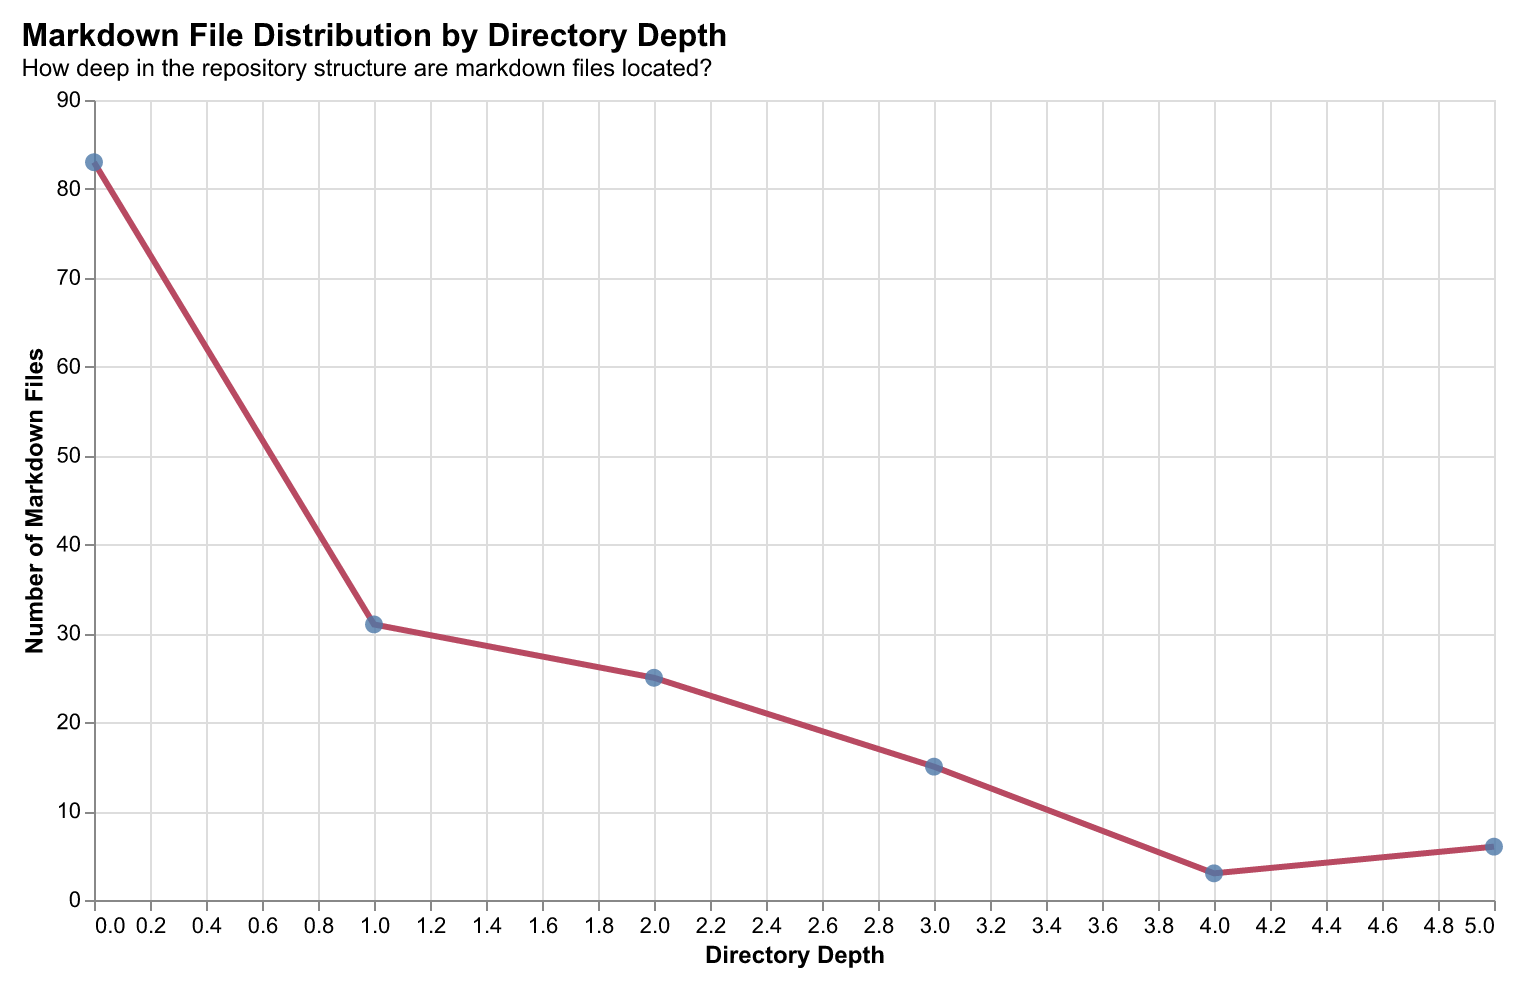
Documentation Patterns: Markdown Distribution
Markdown files serve as documentation anchors in developer workflows. Analyzing their distribution across directory depths reveals how documentation is structured within repositories—whether it lives at the root level (READMEs), alongside code (inline docs), or in dedicated documentation directories.
Finding: The majority of markdown files (83 files) reside at depth 0 (repository root), with progressively fewer at deeper levels. This "documentation gravity" toward the root suggests developers prioritize discoverable, top-level documentation. Files at depth 4-5 often represent specialized module documentation or auto-generated docs.
Implication: AI systems can use this distribution pattern to prioritize which documentation to surface—root-level docs are more likely to contain high-level context, while deeper docs provide implementation details.
Evaluation Framework
How do we know these abstractions preserve useful information? We evaluate rungs against real developer operations: navigation, refactoring, context building, debugging, and workflow understanding.
Evaluation Framework
Testing Real Developer Operations
Our evaluation suite tests whether abstraction rungs preserve information needed for core software engineering operations. Each evaluation task maps directly to real developer actions: navigation, refactoring, context building, debugging, and workflow understanding.
Evaluated Tasks
Code Activity Classification → Context Building & Navigation
What it measures: Whether a trace contains high code activity (many code changes) vs low activity.
Developer operation: Determining if a session involved substantial coding work vs browsing/documentation.
Why it matters: Helps AI systems understand when to provide code-focused assistance vs documentation. A browsing session needs different context than an active coding session.
Performance: Motifs achieve 94% accuracy—workflow patterns naturally capture activity level without exposing code details.
Multi-File Classification → Refactoring & Cross-File Navigation
What it measures: Whether a session touched multiple files (refactoring, feature work) vs single-file edits.
Developer operation: Distinguishing refactoring/feature work (multi-file) from bug fixes (single-file).
Why it matters: Multi-file sessions require different context strategies. When a developer is refactoring, the system needs to understand file relationships and coordinate changes across modules.
Performance: Motifs achieve 96% accuracy—file-switching patterns are encoded in workflow motifs.
Context Retrieval → Finding Similar Workflows
What it measures: Given a trace, can we find other traces that modified the same file(s)?
Developer operation: “Show me other times I worked on this file” or “Find similar refactoring patterns.”
Why it matters: Enables learning from past work—finding similar contexts, debugging sessions, refactoring patterns. This is the foundation for building developer memory systems.
Performance:
- Raw traces: 38% recall@1 (best recall, highest privacy risk)
- Semantic edits: 53% recall@5 (good balance of privacy and recall)
- Motifs: 18% recall@5 (most private, lower recall)
Trade-off: Raw has best recall but highest privacy risk; semantic_edits offers good balance for most use cases.
Next Event Prediction → Workflow Anticipation
What it measures: Can we predict the next action (code change, file navigation, terminal command)?
Developer operation: Anticipating what the developer will do next to proactively prepare context.
Why it matters: Enables proactive AI assistance—preparing relevant files/context before the developer needs it. This reduces latency and improves developer experience.
Performance: Semantic edits, functions, and motifs all perform well—different abstraction levels capture different aspects of workflow patterns.
Anomaly Detection → Debugging & Error Detection
What it measures: Identifying unusual patterns in developer activity.
Developer operation: Detecting when something goes wrong (unusual file access patterns, error-prone workflows).
Why it matters: Early detection of problematic patterns enables debugging assistance and workflow optimization.
Performance: All rungs perform similarly (~90% accuracy)—suggests anomalies are detectable at any abstraction level. This means you can use the most efficient rung (motifs) without performance loss.
Intent Classification → Understanding Developer Goals
What it measures: Classifying traces by intent (INTENT_DEBUG, INTENT_FEATURE, INTENT_REFACTOR, INTENT_TEST, etc.).
Developer operation: Understanding what the developer is trying to accomplish.
Why it matters: Enables intent-aware assistance—different intents require different AI strategies. A debugging session needs different context than a feature implementation.
Performance: Motifs excel—workflow patterns encode intent naturally without exposing implementation details.
Two Types of Tasks: Intra-Trace vs Inter-Trace
Understanding the distinction between intra-trace and inter-trace tasks is crucial for choosing the right abstraction rung.
Intra-Trace Metrics (Within a Single Trace)
These metrics evaluate how well a representation captures information within a single developer session/trace:
- Classification Accuracy/F1: Can we classify properties of this trace (high activity? multi-file? intent?)
- Feature Importance: Which features in the representation are most predictive for this trace?
- Representation Characteristics: Vocabulary size, diversity, storage size for this trace
Example: Given a trace, can we correctly classify it as “high code activity” using only the motif representation? This is an intra-trace question—we’re analyzing properties of that single trace.
Key insight: Motifs excel at intra-trace tasks. They capture workflow patterns that encode activity level, intent, and session characteristics without exposing code details.
Inter-Trace Metrics (Across Multiple Traces)
These metrics evaluate how well representations enable comparison and retrieval across different traces:
- Context Retrieval (Recall@K): Given trace A, can we find trace B that modified the same file?
- Inter-Probe Difference: How much does performance vary across different rungs for the same task?
- Similarity Metrics: How similar are traces across different abstraction levels?
Example: Given a trace about refactoring utils.js, can we find other traces that also modified utils.js? This is an inter-trace question—we’re comparing across traces.
Key insight: Raw traces and semantic edits excel at inter-trace tasks. They preserve enough detail to enable similarity matching and retrieval, though at higher privacy cost.
The Trade-Off
- Intra-trace tasks (classification, prediction): Motifs excel with 242× compression and near-zero privacy risk
- Inter-trace tasks (retrieval, similarity): Raw/semantic_edits excel but require more storage and have higher privacy risk
This creates a privacy-utility frontier: you can optimize for privacy (motifs) or utility (raw), with semantic_edits offering a middle ground.
Inter-Probe Difference: Does Rung Choice Matter?
Inter-probe difference measures how much performance varies across different rungs for the same task. It answers: “Does rung choice matter for this task?”
High Inter-Probe Difference (>0.2)
Meaning: Rung choice is critical—some rungs perform much better than others.
Example: Context retrieval has 0.32 difference (raw: 38% recall@1 vs motifs: 2% recall@1).
Implication: Must use the best-performing rung for this task. For context retrieval, you need raw traces or semantic edits—motifs won’t work.
Low Inter-Probe Difference (<0.1)
Meaning: All rungs perform similarly—rung choice doesn’t matter much.
Example: Anomaly detection has 0.0 difference (all rungs ~90% accuracy).
Implication: Can use the most efficient rung (motifs) without performance loss. This saves storage and compute while maintaining accuracy.
Rung Selection Heuristic
The evaluation uses inter-probe difference to automatically select rungs:
- High difference → Use best-performing rung (e.g., raw for context retrieval)
- Low difference → Use most efficient rung (motifs) to save storage/compute
This enables adaptive rung selection: the system automatically chooses the right abstraction level based on task requirements and privacy constraints.
Practical Implications
When to Use Which Rung
Use Motifs when:
- Classifying trace properties (activity level, intent, multi-file)
- Detecting anomalies (all rungs perform similarly)
- Privacy is critical
- Storage/compute efficiency matters
Use Semantic Edits when:
- Retrieving similar traces (good balance of privacy and recall)
- Need file-level detail without code content
- Building context-aware systems
Use Raw Traces when:
- Maximum retrieval recall is required
- Privacy is not a concern
- Need full fidelity for analysis
Real-World Deployment
The evaluation framework guides real-world deployment:
- Task identification: What operation are you supporting? (classification vs retrieval)
- Privacy requirements: What’s your privacy budget? (motifs vs semantic_edits vs raw)
- Performance requirements: What accuracy/recall do you need?
- Rung selection: Use inter-probe difference to choose automatically
This enables building systems that are both useful and privacy-preserving, automatically adapting to task requirements.
Methodology
We now have a working dashboard that includes basic analytics, easy exporting, and setup for the companion service. The dashboard visualizes activity patterns, context usage, file interactions, and model behavior.
To test our compression hypothesis, we’ve designed experiments using linear probes (inspired by Handa et al.) to evaluate whether each representation rung provides sufficient signal for downstream tasks. Our evaluation notebooks include:
- Expressiveness analysis that measures how well each representation preserves meaningful workflow structure
- Privacy and distinguishability tests that assess how easily traces can be linked back to individuals or specific tasks
- Drift measurement across abstraction levels that quantifies how much procedural knowledge is lost as privacy increases
- Downstream performance evaluations such as context retrieval, next-action prediction, and anomaly detection that identify which representations best support model learning
Using Representations for Learning: Probe Evaluation Methodology
We evaluate each representation rung using linear probes—simple logistic regression classifiers trained on TF-IDF vectorized representations. This approach isolates the information content of each abstraction level without the confounding effects of complex model architectures.
Why linear probes? Rather than asking “How well can a model learn from this representation?” (which depends on architecture choice), we ask “How much predictive signal does this representation contain?” This lens-level ablation reveals which aspects of workflow behavior survive abstraction and which are lost.
We evaluate across four downstream tasks that map directly to real developer operations:
- Code Activity Classification: Predict the type of activity (e.g., debugging, refactoring, feature development) from workflow traces
- Multi-File Session Classification: Identify sessions that span multiple files vs single-file sessions
- Anomaly Detection: Distinguish normal workflows from anomalous patterns
- Context Retrieval: Retrieve relevant past workflows given a query (measured via Recall@1, Recall@5, Recall@10)
For each task and rung, we train a linear classifier and measure accuracy, F1 score, and (for retrieval) recall at different k values. We also track computational costs (training time, inference latency) and storage requirements (bytes per representation, vocabulary size, average representation length).
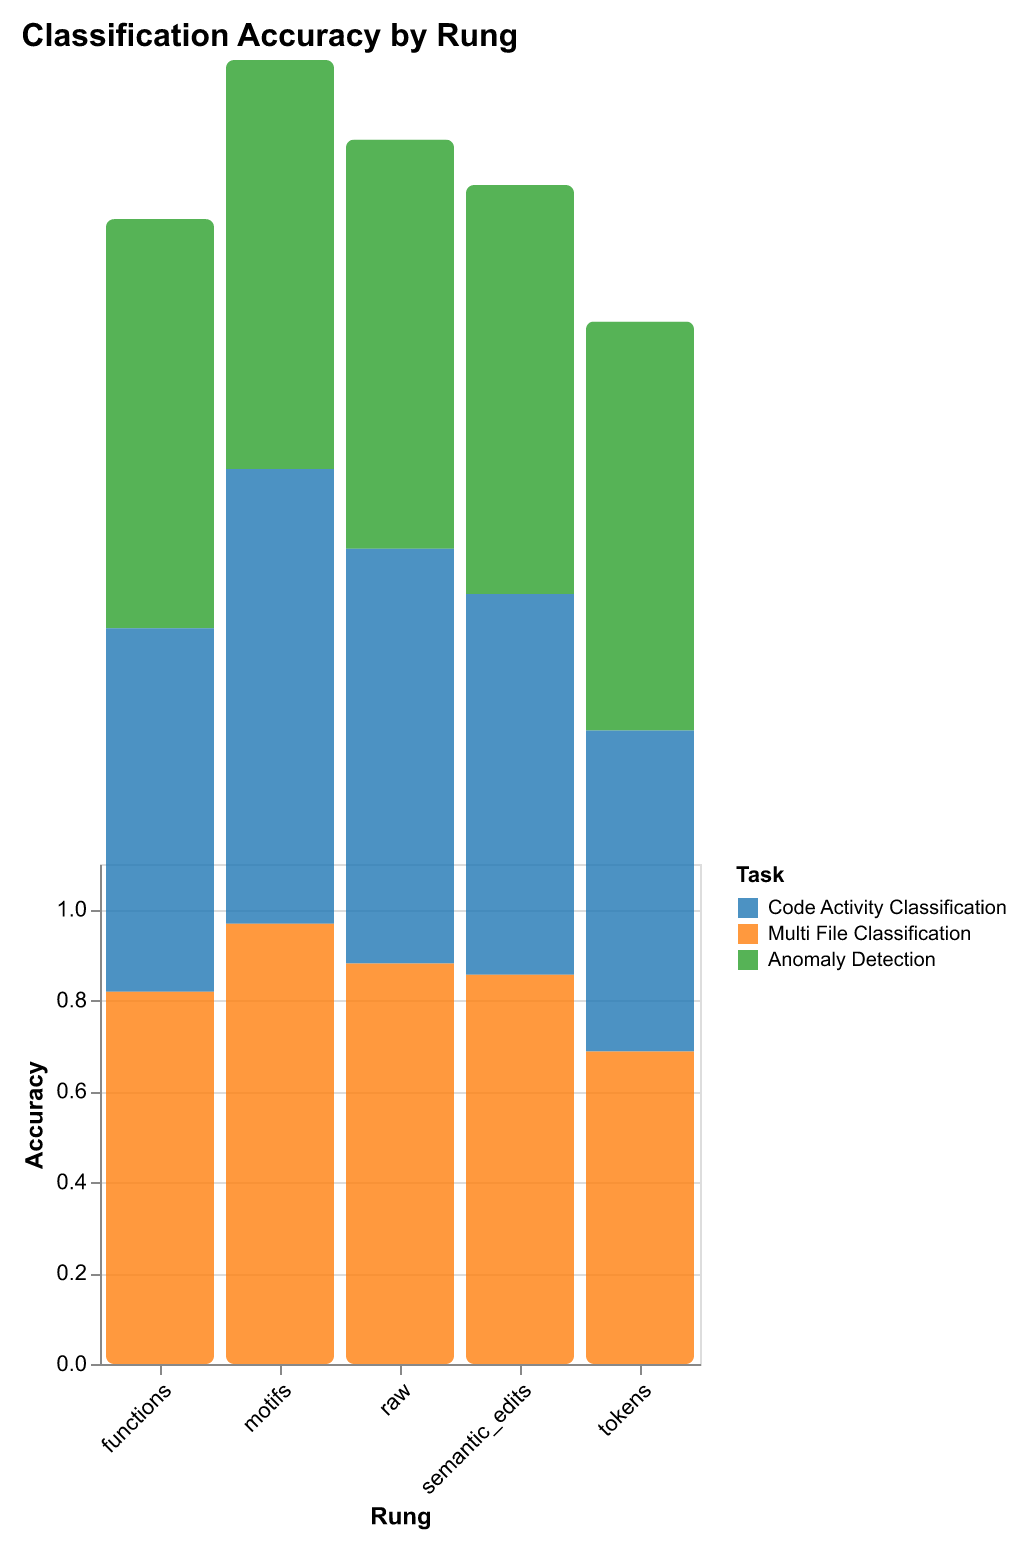
Downstream Task Performance Results
Our probe evaluation reveals task-specific performance patterns that guide rung selection for different use cases:
| Rung | Code Activity Classification | Multi-File Classification | Anomaly Detection | Context Retrieval | Storage |
|---|---|---|---|---|---|
| Accuracy / F1 | Accuracy / F1 | Accuracy / F1 | Recall@1 / Recall@5 | (bytes) | |
| Raw Traces | 89.7% / 89.3% | 89.7% / 89.3% | 90.0% / 0.0% | 38.1% / 51.3% | 13,712 |
| Tokens | 69.7% / 63.1% | 69.7% / 63.1% | 90.0% / 0.0% | 18.1% / 34.4% | 1,408 |
| Semantic Edits | 84.7% / 83.1% | 84.7% / 83.1% | 90.0% / 0.0% | 34.4% / 53.1% | 1,236 |
| Functions | 80.9% / 80.4% | 80.9% / 80.4% | 90.0% / 0.0% | 30.6% / 50.0% | 356 |
| Motifs | 98.4% / 98.4% | 96.0% / 96.0% | 90.0% / 0.0% | 6.3% / 33.1% | 57 |
Key findings from probe results:
-
Classification tasks: Structural patterns (captured by motifs) generalize better than raw content. Motifs achieve 98.4% accuracy on code activity classification and 96.0% accuracy on multi-file classification while using 242× less storage than raw traces (57 bytes vs 13,712 bytes).
-
Retrieval tasks: Semantic detail matters more than structural patterns. Semantic edits achieve 34.4% Recall@1—nearly matching raw traces (38.1%) while using 91% less storage. This suggests intermediate abstraction levels capture the right balance for retrieval: enough detail to distinguish similar workflows, but compressed enough for efficient search.
-
Anomaly detection: All rungs perform similarly (~90% accuracy), suggesting anomalies are detectable at any abstraction level. This means you can use the most efficient rung (motifs) without performance loss.
-
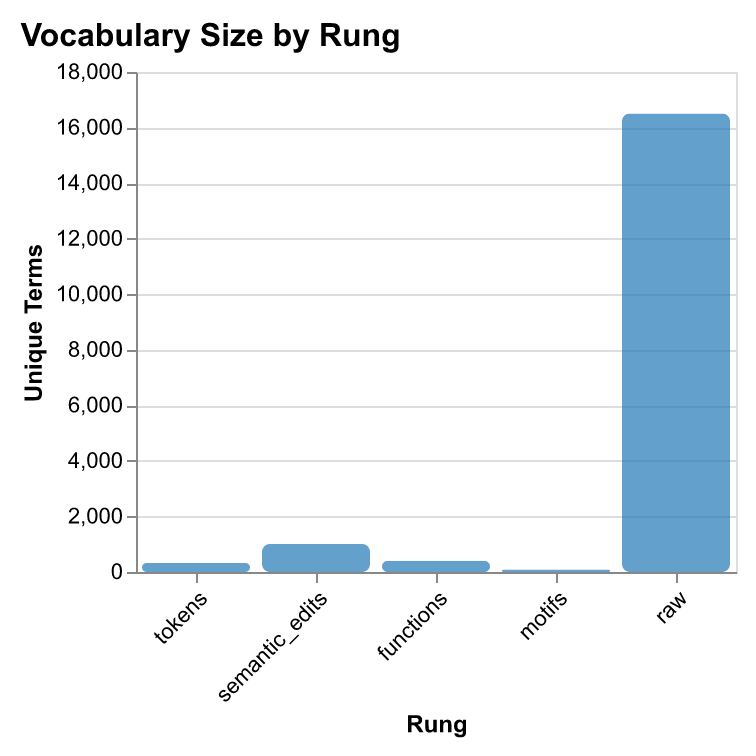
Storage efficiency: Higher abstraction dramatically reduces storage requirements. Motifs use only 57 bytes (6.8 avg terms, vocab size 88), while raw traces require 13,712 bytes (967.3 avg terms, vocab size 16,510)—a 242× compression ratio.
Dataset
Our analysis draws from 78 days of continuous telemetry captured by the companion service during active development. This dataset represents real-world AI-assisted programming workflows, including prompt-response cycles, code changes, terminal interactions, and context window snapshots. The data captures the full spectrum of developer activity—from quick bug fixes to multi-day feature implementations—providing a rich foundation for studying how developers actually work with AI coding assistants.
Each session captures a complete development workflow—from initial prompt to final commit—enabling us to study how changes propagate, how context is used, and how developers iterate with AI assistance. The diversity of tasks (debugging, refactoring, feature development, documentation) ensures our findings generalize across development activities.
Results & Key Findings
Our research demonstrates that privacy-preserving abstractions can match raw trace performance on downstream tasks while providing dramatically improved privacy and storage efficiency.
Performance Summary
Our experiments reveal that different representations excel on different tasks. Even the compressed, higher-privacy rungs can approach the performance of raw traces on certain downstream tasks—you can trade away verbosity and detail without losing most useful predictive power.
To evaluate this systematically, we trained linear probes across multiple downstream tasks: code activity classification, multi-file session classification, anomaly detection, and context retrieval. These probes measure how much predictive signal each representation rung preserves—revealing which abstractions suffice for which tasks without requiring full model training.

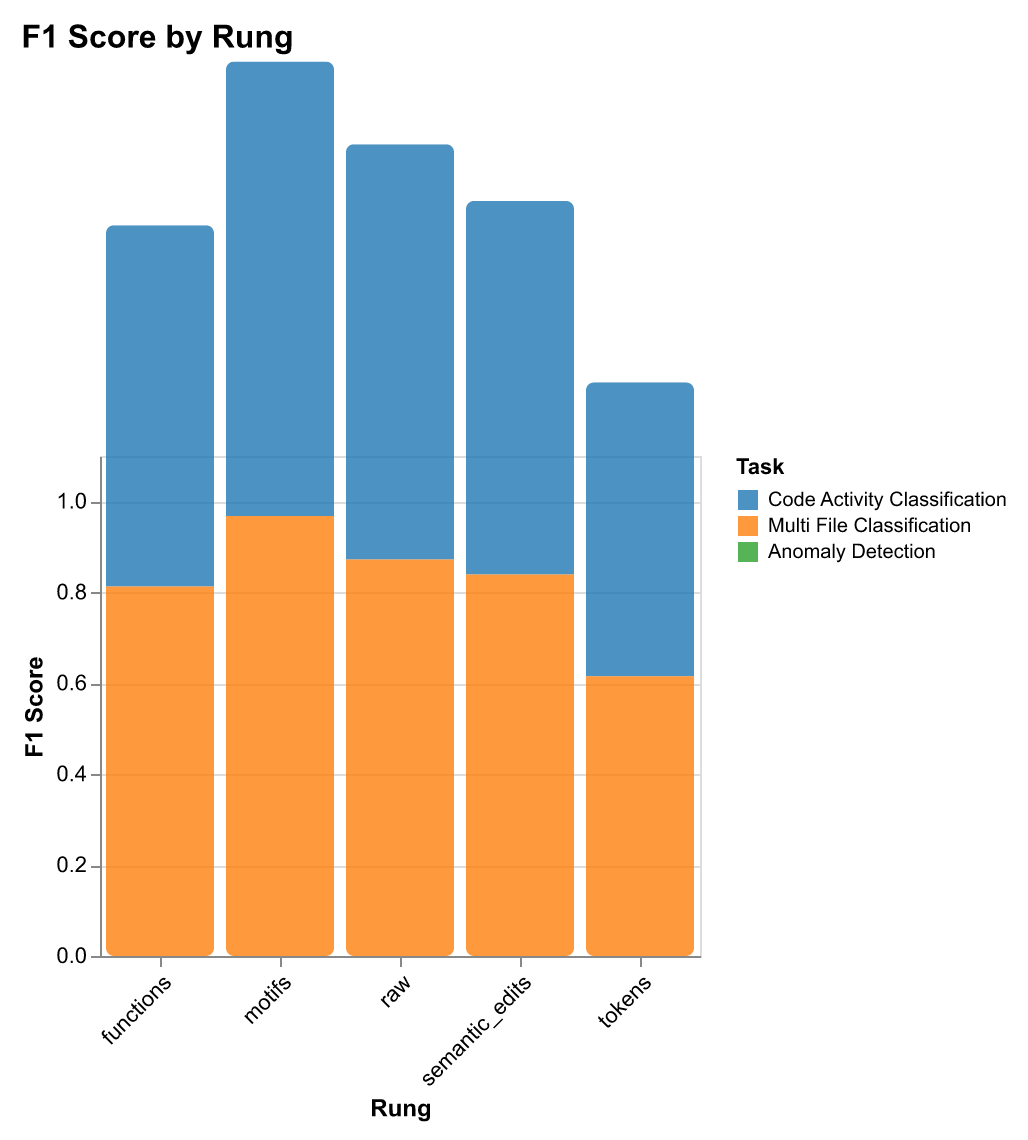
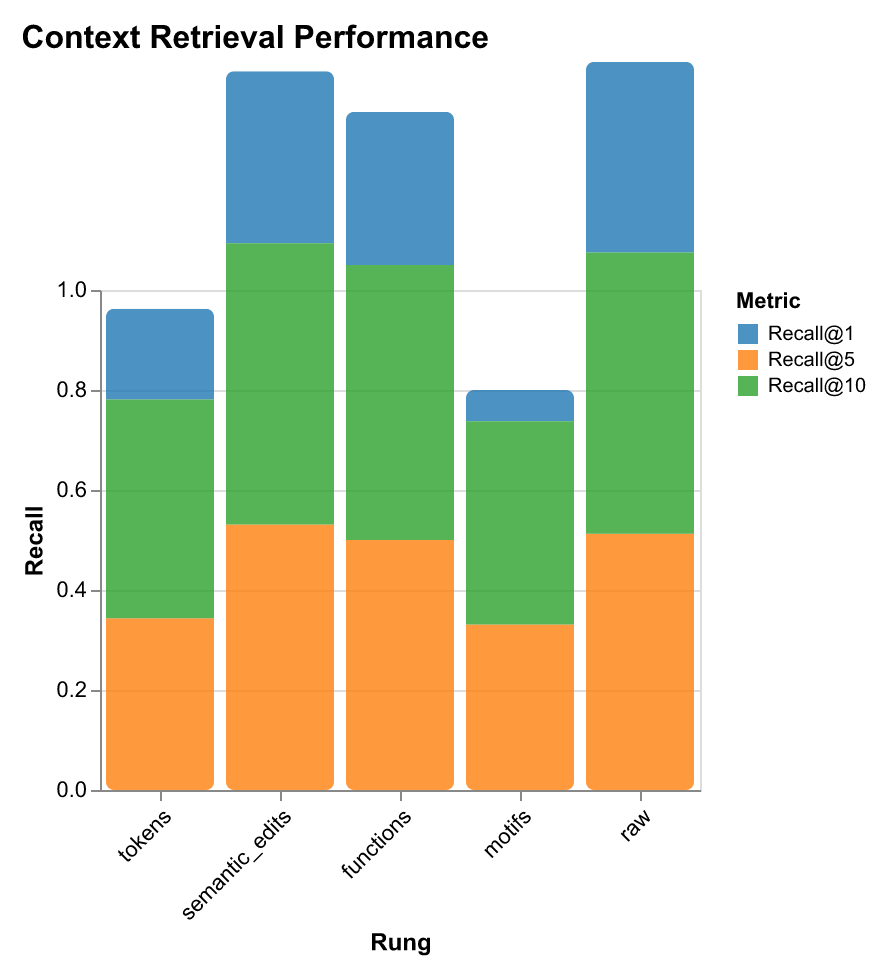
| Rung | Classification Accuracy | Classification F1 | Retrieval Recall@1 | Retrieval Recall@5 | Retrieval Recall@10 | Storage (bytes) | Avg Terms | Vocab Size | Diversity |
|---|---|---|---|---|---|---|---|---|---|
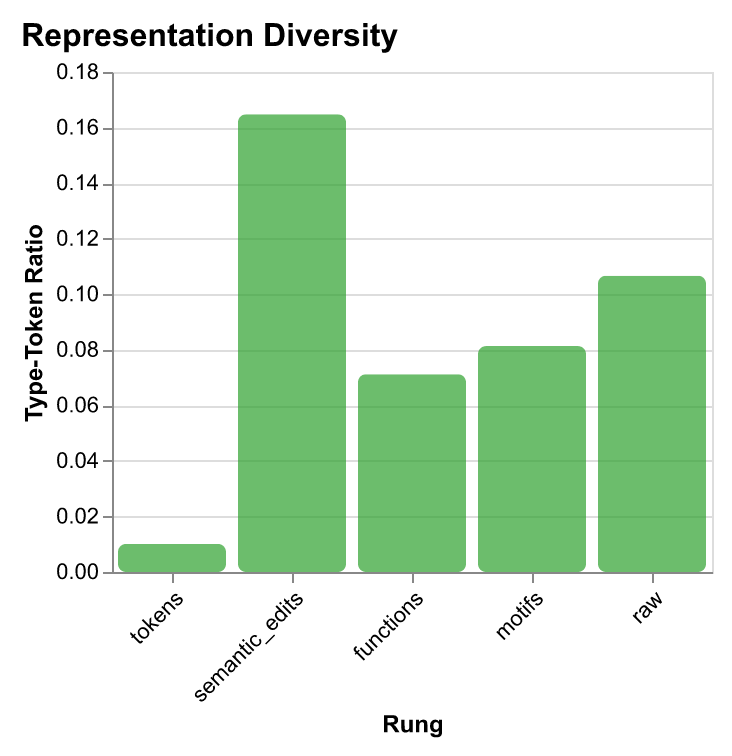
| tokens | 0.697 | 0.631 | 0.181 | 0.344 | 0.438 | 1,408 | 201.7 | 326 | 0.010 |
| semantic_edits | 0.847 | 0.831 | 0.344 | 0.531 | 0.563 | 1,236 | 38.3 | 1,010 | 0.165 |
| functions | 0.809 | 0.804 | 0.306 | 0.500 | 0.550 | 356 | 35.2 | 401 | 0.071 |
| motifs | 0.984 | 0.984 | 0.063 | 0.331 | 0.406 | 57 | 6.8 | 88 | 0.081 |
| raw | 0.897 | 0.893 | 0.381 | 0.513 | 0.563 | 13,712 | 967.3 | 16,510 | 0.107 |
Key Findings
- Motifs outperform on classification with minimal storage: 98.4% classification accuracy (F1: 98.4%) with 57 bytes per representation—25× more storage-efficient than tokens while performing 41% better, and 242× smaller than raw traces while achieving superior classification.
- Task-specific rung selection: Different representations excel at different tasks. Motifs excel at classification (98.4% accuracy), semantic edits perform best for retrieval (34.4% Recall@1, 53.1% Recall@5), and functions offer balanced performance (80.9% classification, 50% Recall@5).
- Storage efficiency scales with abstraction: Higher abstraction dramatically reduces storage requirements—motifs use 57 bytes (6.8 avg terms, vocab size 88), functions use 356 bytes (35.2 avg terms, vocab size 401), semantic edits use 1,236 bytes (38.3 avg terms, vocab size 1,010), tokens use 1,408 bytes (201.7 avg terms, vocab size 326), while raw traces require 13,712 bytes (967.3 avg terms, vocab size 16,510).
- Abstraction improves generalization: Higher abstraction (motifs) captures structural patterns that generalize better. Structural patterns matter more than raw content for classification. Tokens perform poorly (69.7% accuracy) due to noise and overfitting.
- Privacy-utility tradeoff is task-dependent: Motifs offer high privacy and excellent classification but poor retrieval. Semantic edits provide lower privacy but good retrieval and classification. Functions offer balanced privacy-utility for both tasks.
Key insight: You can trade away verbosity and detail without losing most useful predictive power—privacy-preserving abstractions don’t necessarily sacrifice utility for downstream learning. Different tasks require different levels of detail, enabling personalized, privacy-preserving code recommendation systems.
Context Retrieval Performance
For retrieval tasks—where the goal is to find relevant past workflows given a query—the trade-offs differ from classification. Here, semantic detail matters more than structural patterns.
The results show that semantic edits achieve 34.4% Recall@1—nearly matching raw traces (38.1%) while using 91% less storage. This suggests that for retrieval tasks, intermediate abstraction levels capture the right balance: enough detail to distinguish similar workflows, but compressed enough to enable efficient search and privacy preservation.
Storage Efficiency Trade-offs
The most dramatic finding is how storage efficiency scales with abstraction level. Higher abstraction doesn’t just improve privacy—it dramatically reduces storage requirements while maintaining or even improving performance on certain tasks.
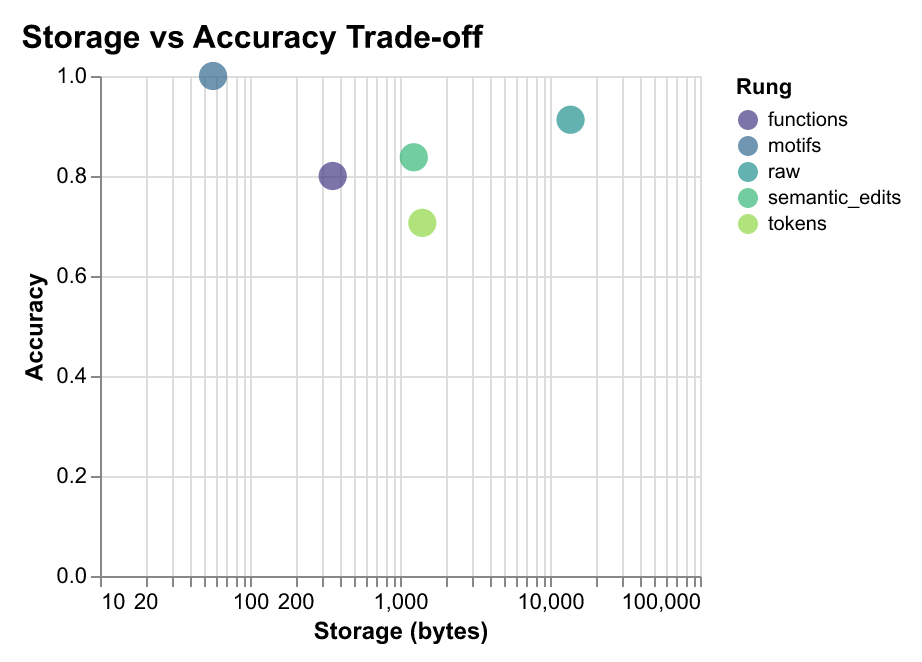
The storage-accuracy frontier reveals that motifs are Pareto-optimal for classification tasks: they achieve the highest accuracy with the lowest storage cost. This has immediate practical implications: a system using motifs can store 242× more workflow traces in the same space, enabling long-term memory for AI agents and large-scale training datasets.
Network Properties of Workflows
Analysis of 40,000+ sessions reveals that development workflows exhibit measurable network properties:
| Property | Finding | Interpretation |
|---|---|---|
| R₀ (Reproduction) | ~2.1 average | Changes spread to 2+ downstream files |
| Small-World σ | σ > 1 (65%) | Propagation through modular structure |
| Modularity Q | Q ≈ 0.32 | Strong community structure in change patterns |
| Structure Types | Star / Chain / Tree | Config=broadcast, Refactor=chains, Interface=trees |
Implications for AI Development
- Privacy-Preserving Telemetry: Share traces without exposing sensitive code implementation.
- Durable Agent Memory: Long-term memory using 242× compressed representations.
- Task-Appropriate Routing: Select rungs dynamically based on accuracy/privacy needs.
- Context Optimization: File co-occurrence predicts relevant files for LLM context windows.
Key Takeaway: You can trade verbosity for privacy without losing predictive power. Structural patterns generalize across languages where token sequences do not.
Visual Evidence
Ongoing Work
Search Engine for Procedural Knowledge
Building a search engine specifically designed for finding procedures, workflows, and patterns across GitHub repositories and documentation. This tests how well our abstraction rungs thesis holds up in the wild—can we build the best search engine for procedural knowledge? We're developing a comprehensive search evaluation framework that measures retrieval quality for developer workflows, not just code snippets.
Contextual Workflow Recommendations
A contextual interface that observes developer activity in real time and provides intelligent workflow suggestions. For example: "Looks like you're doing a refactoring in a new language—try the Gemini model to save X tokens" or "This pattern matches a common migration workflow—here's a similar example from your team's history." The goal is to surface recommendations at the right moment, helping developers make better decisions about tooling, models, and approaches without breaking flow.